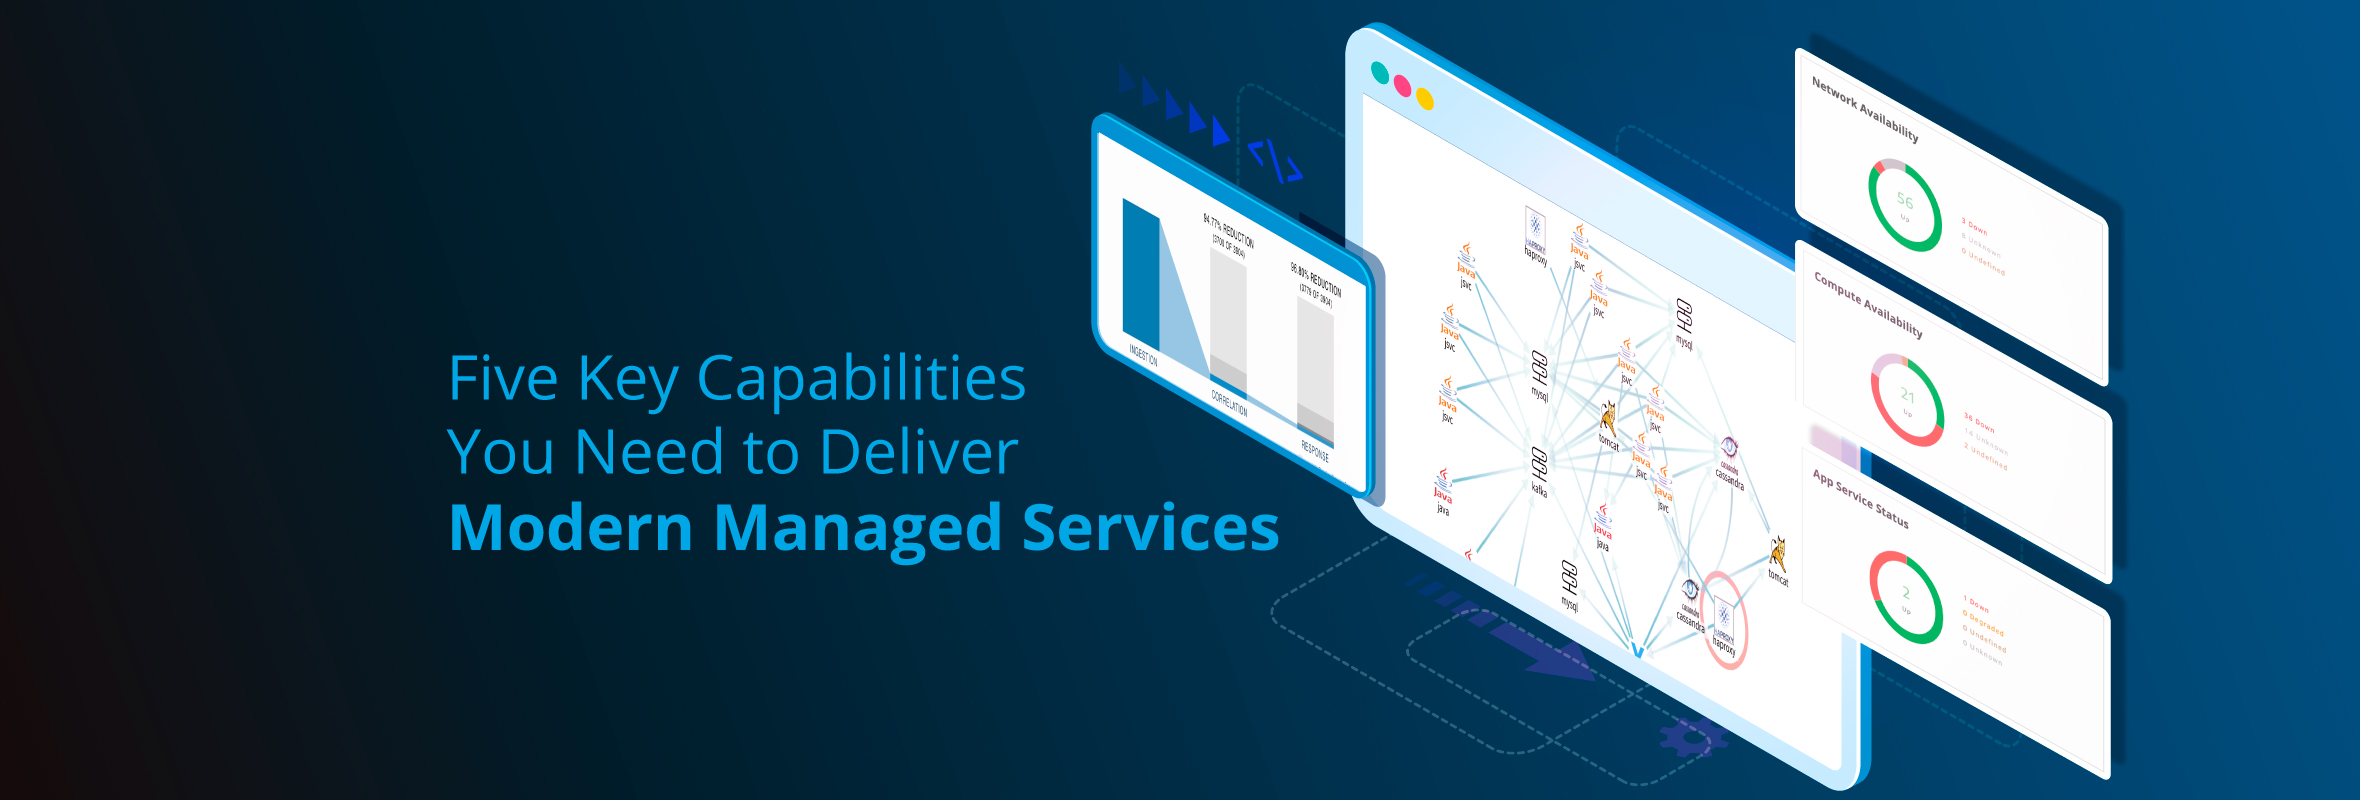
After our May and August product updates, we’re proud to announce the Fall 2018 release, which is all about meeting the challenges of digital transformation. Our latest update introduces new capabilities for embracing agile IT operations, with contextual service visibility, expanded cloud database monitoring, and targeted alert notifications. Here is a summary of what’s new:
Topology Explorer
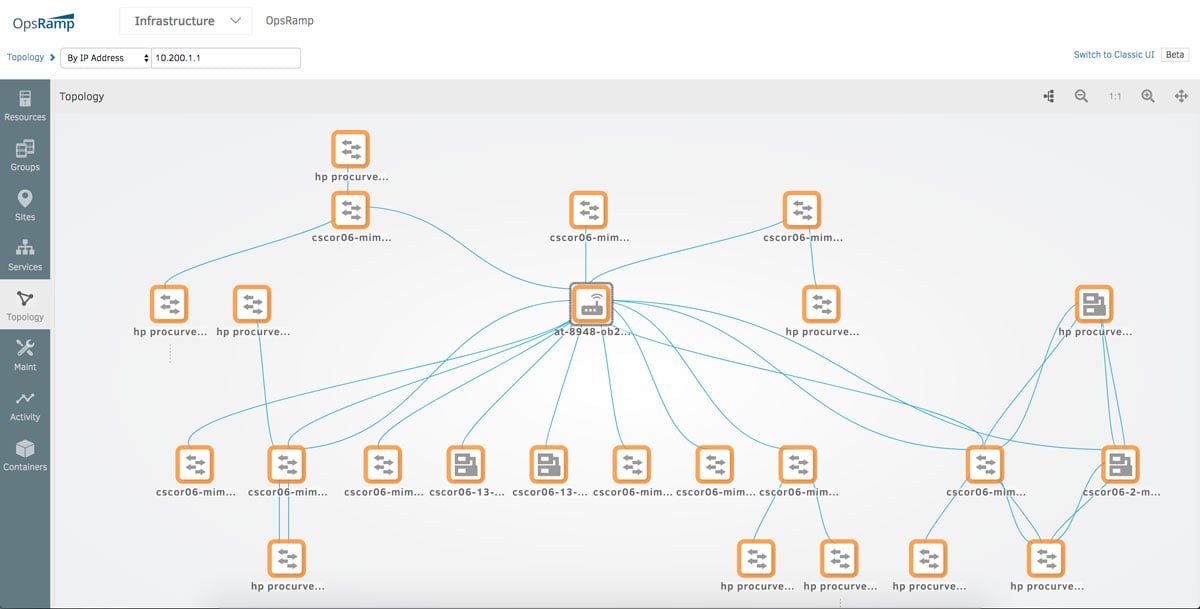
Our Unified Service Discovery solution lets you onboard and track all your hybrid IT resources. In this release, we’re introducing Topology Explorer that dynamically takes these discovered IT assets and helps you understand the infrastructure dependencies and interconnections for your IT services. The Topology Explorer delivers deep impact analysis and faster troubleshooting for your hybrid infrastructure estate with:
- Network Mapping. Deliver real-time network insights and visibility, by mapping any resource in your datacenter through agentless monitoring.
- Application Mapping. Collect metadata, cluster details, and dependencies for your entire application stack, with the ability to discover more than 40 cloud-native applications.
Service Maps
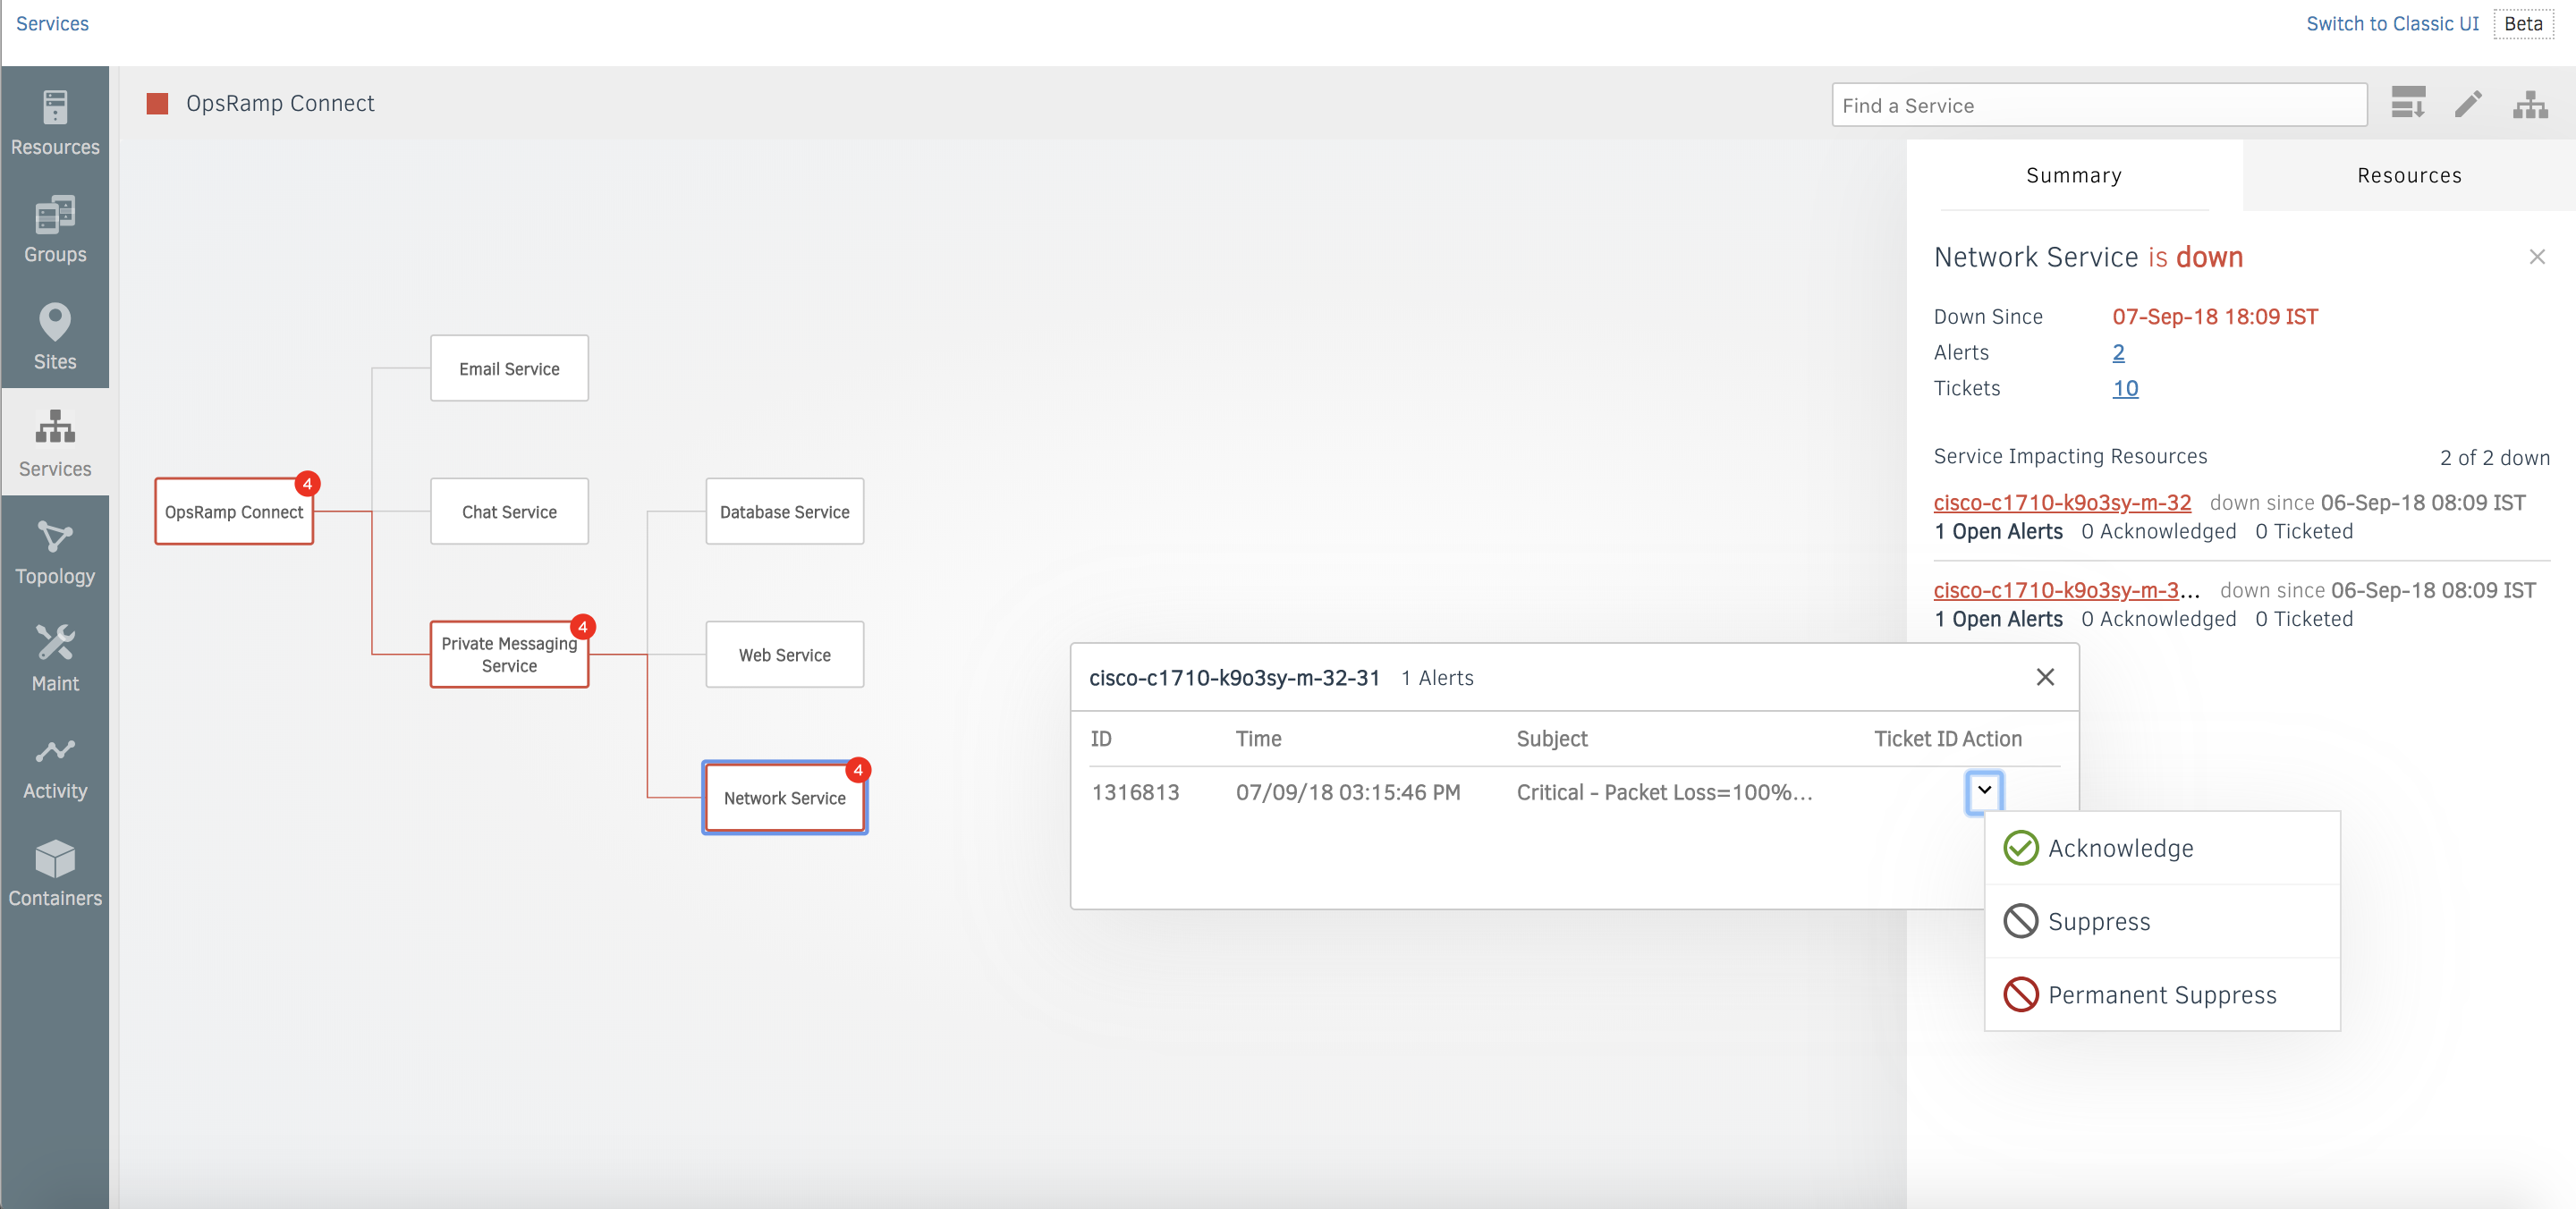
Our enhanced Service Maps help you understand business service impact when a resource goes down. Drive contextual visibility by viewing alerts within a service map as well as accessing impacted services in the alert details page. Understand what’s affecting the availability and performance of your IT services with a real-time picture of your applications and supporting infrastructure workloads.
Multi-Cloud Database Monitoring
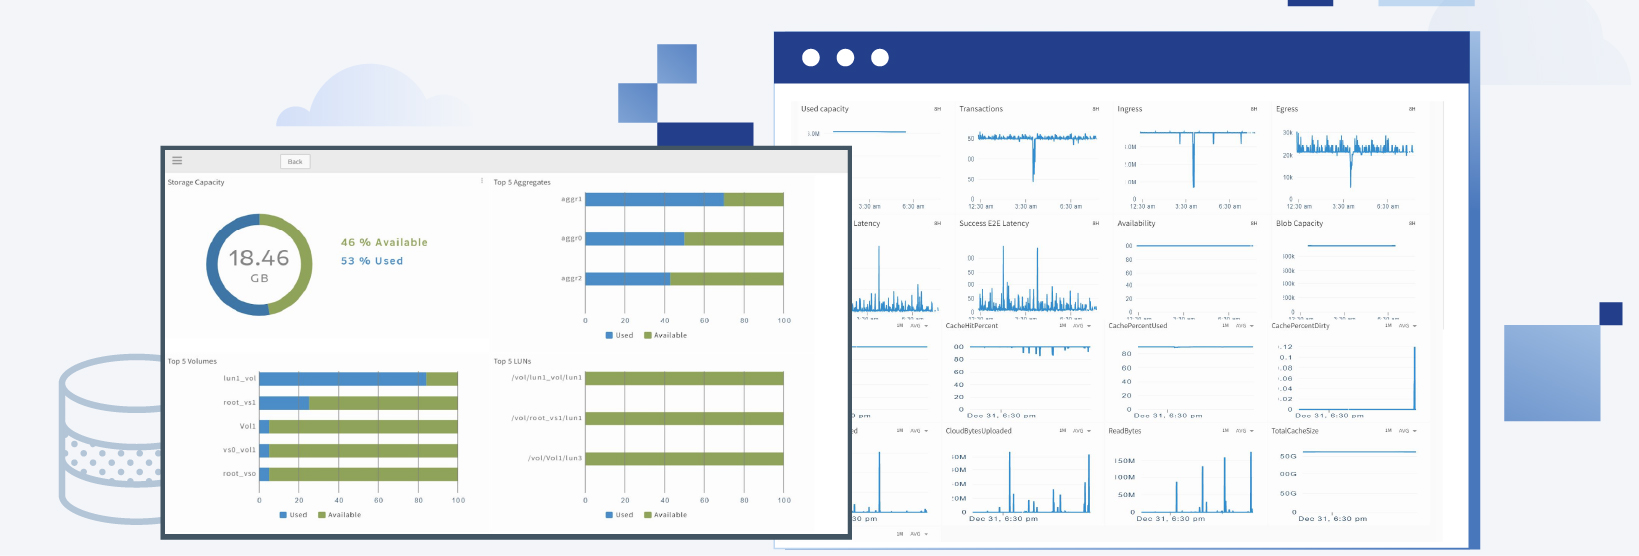
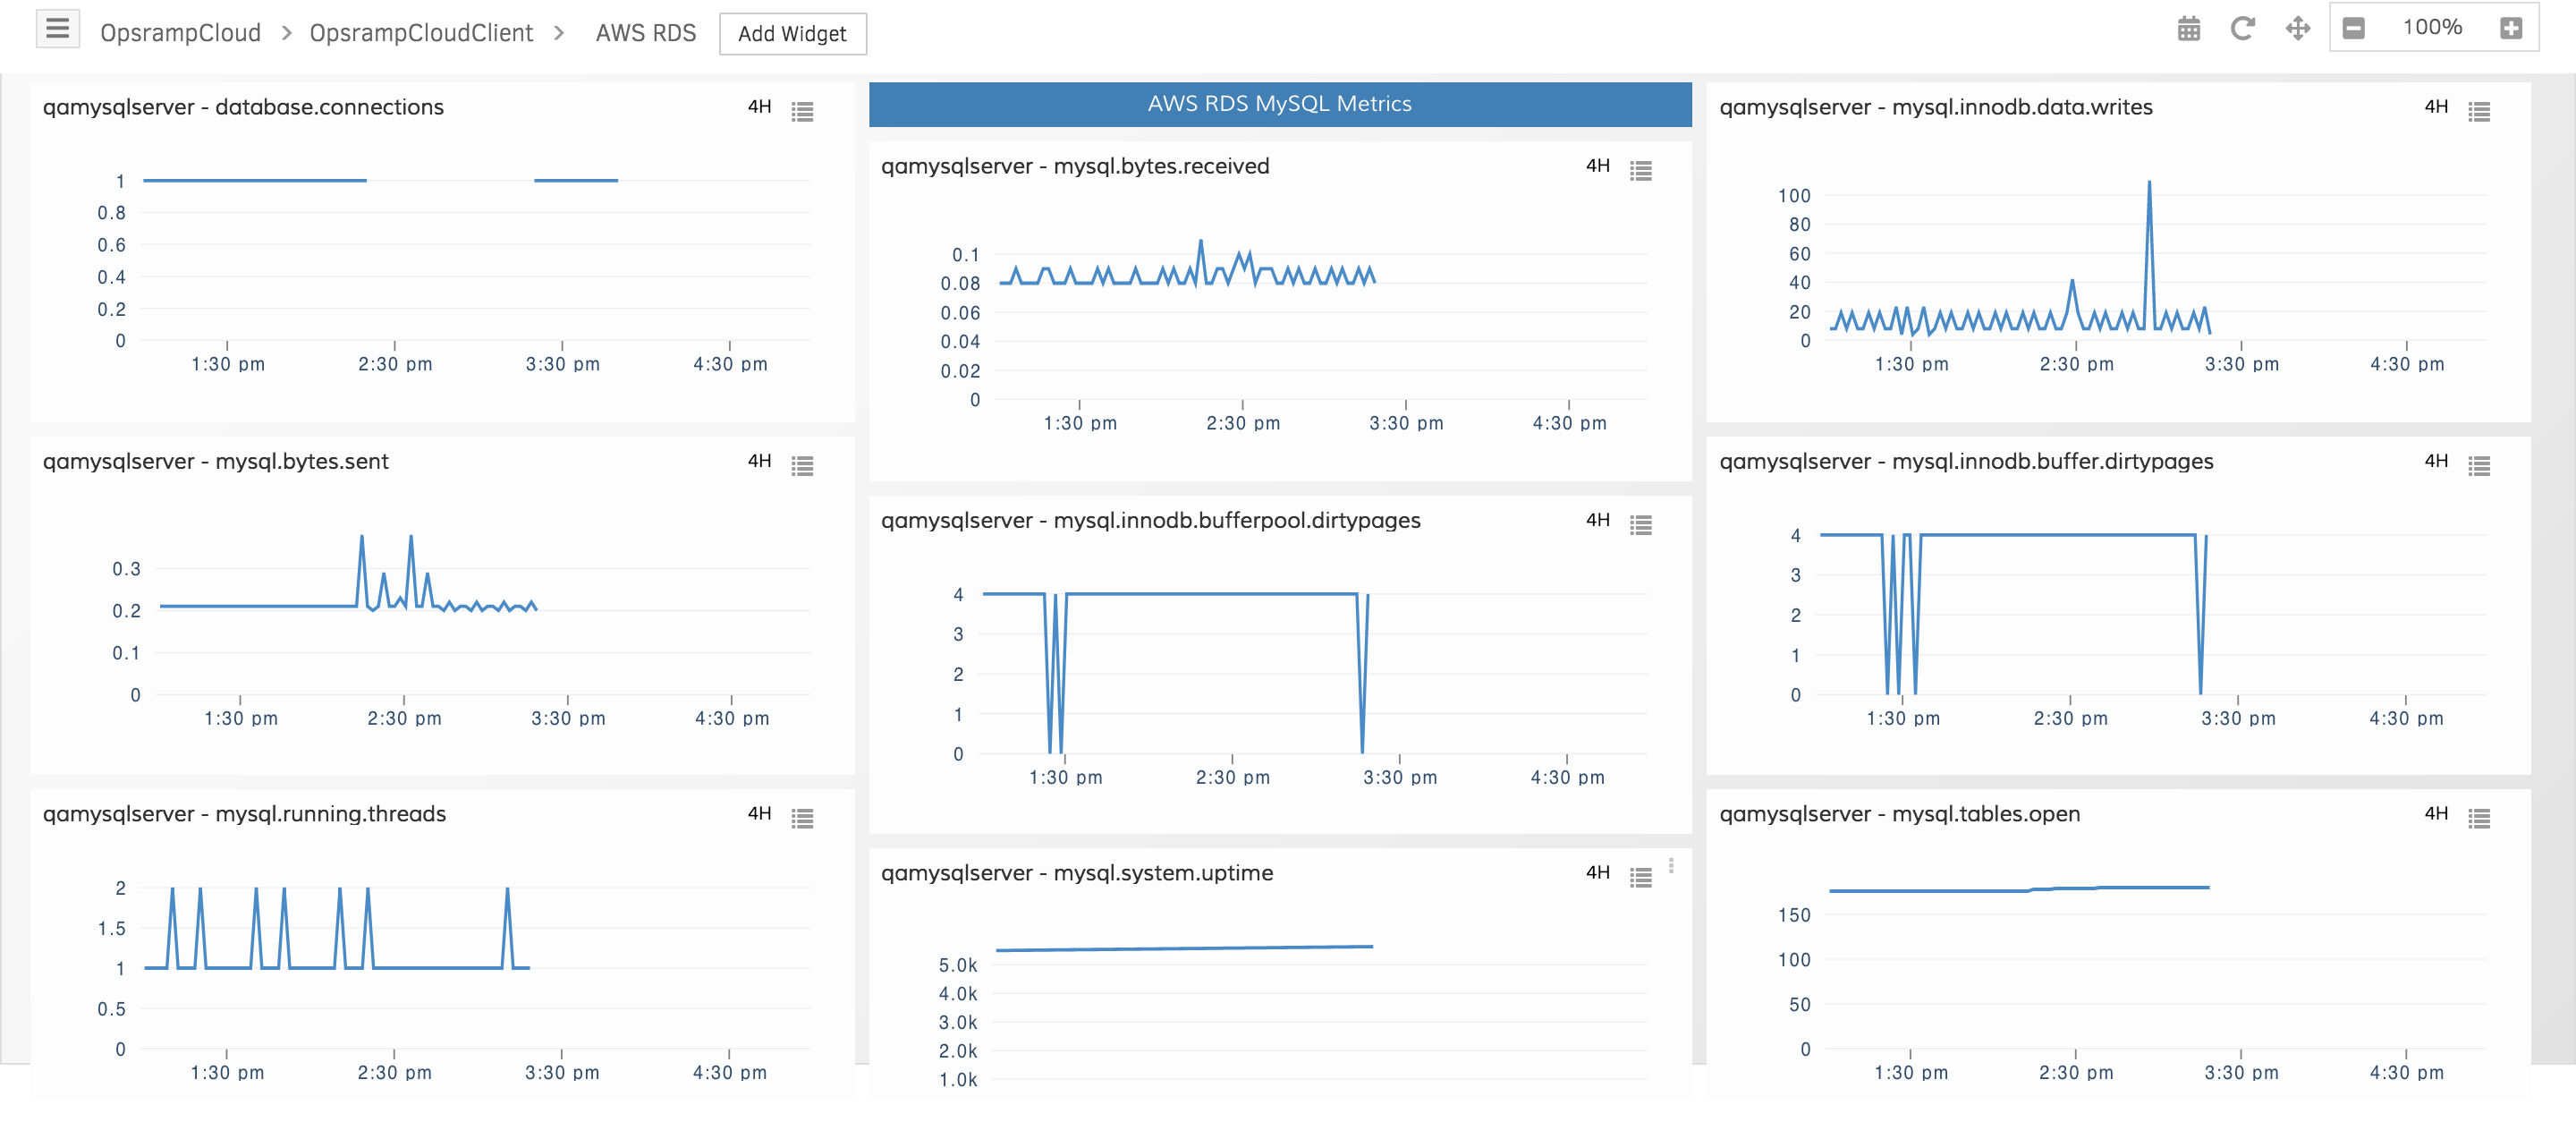
Enterprises are increasingly building their digital apps and services on Amazon Relational Database Services (Aurora, PostgreSQL, MySQL, MariaDB, Oracle, and Microsoft SQL Server), Microsoft Azure (SQL Database, Azure Database for PostgreSQL, Azure Database for MySQL), and Google Cloud Platform (Cloud SQL). How do you manage a diverse footprint of databases servers across the leading public cloud providers?
OpsRamp lets you optimize and finetune database performance with relevant metrics and smart alerts. Check the health of your database servers with query-level performance insights and get notified about potential problems before they become business-impacting events.
Alert Management
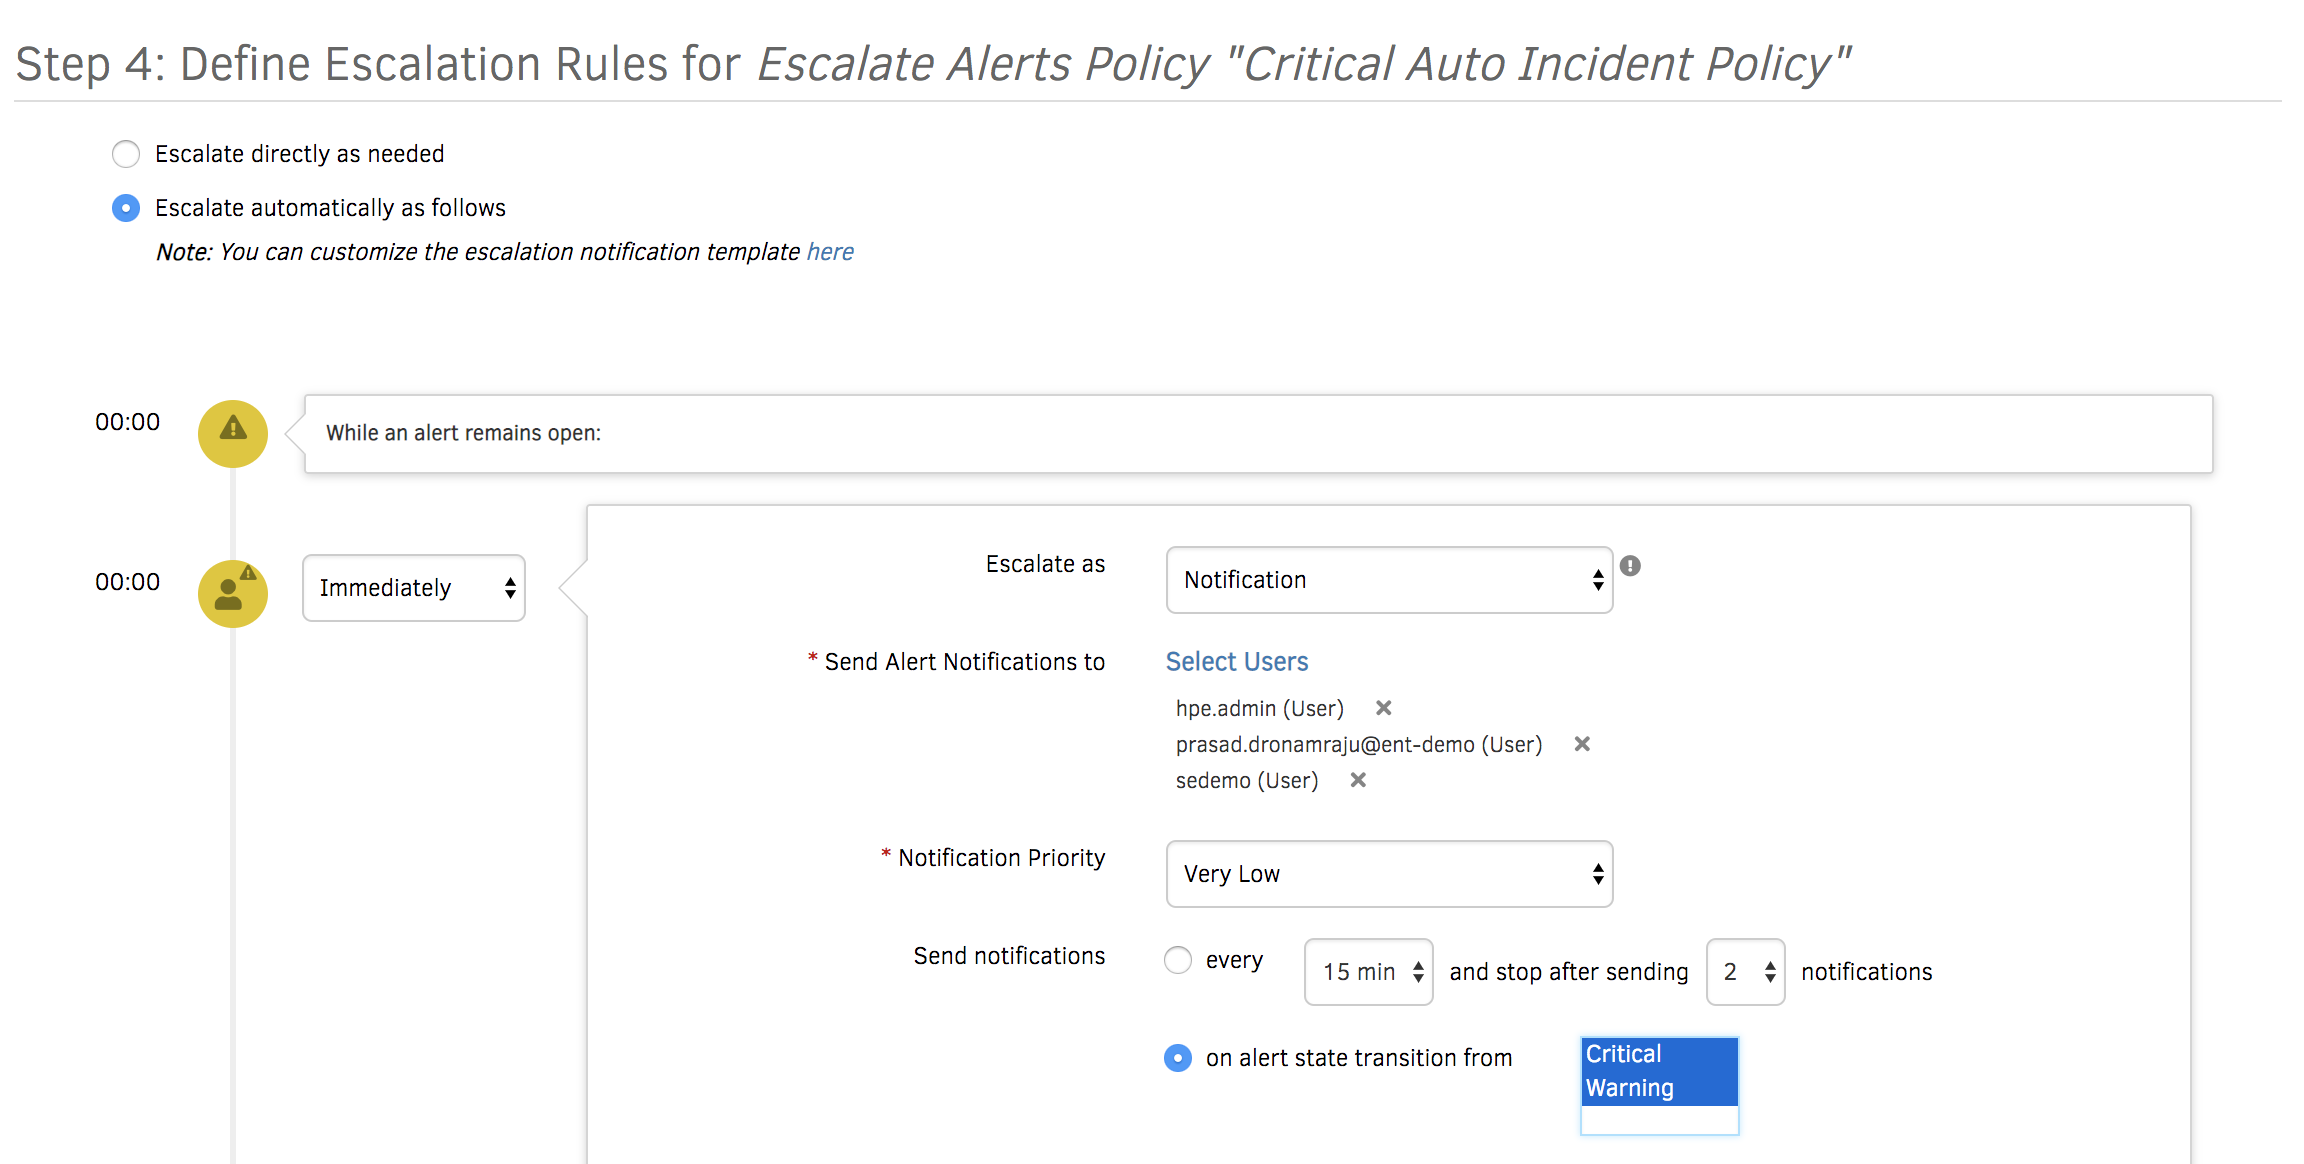
We’ve added some important enhancements to our Alert management capabilities. You can define escalation policies to queue alerts during a maintenance window and get notified once the maintenance ends. You can now receive notifications on alert state changes (when an alert transitions to a critical or warning state) so that you can quickly focus on restoring IT services.
Custom Reporting
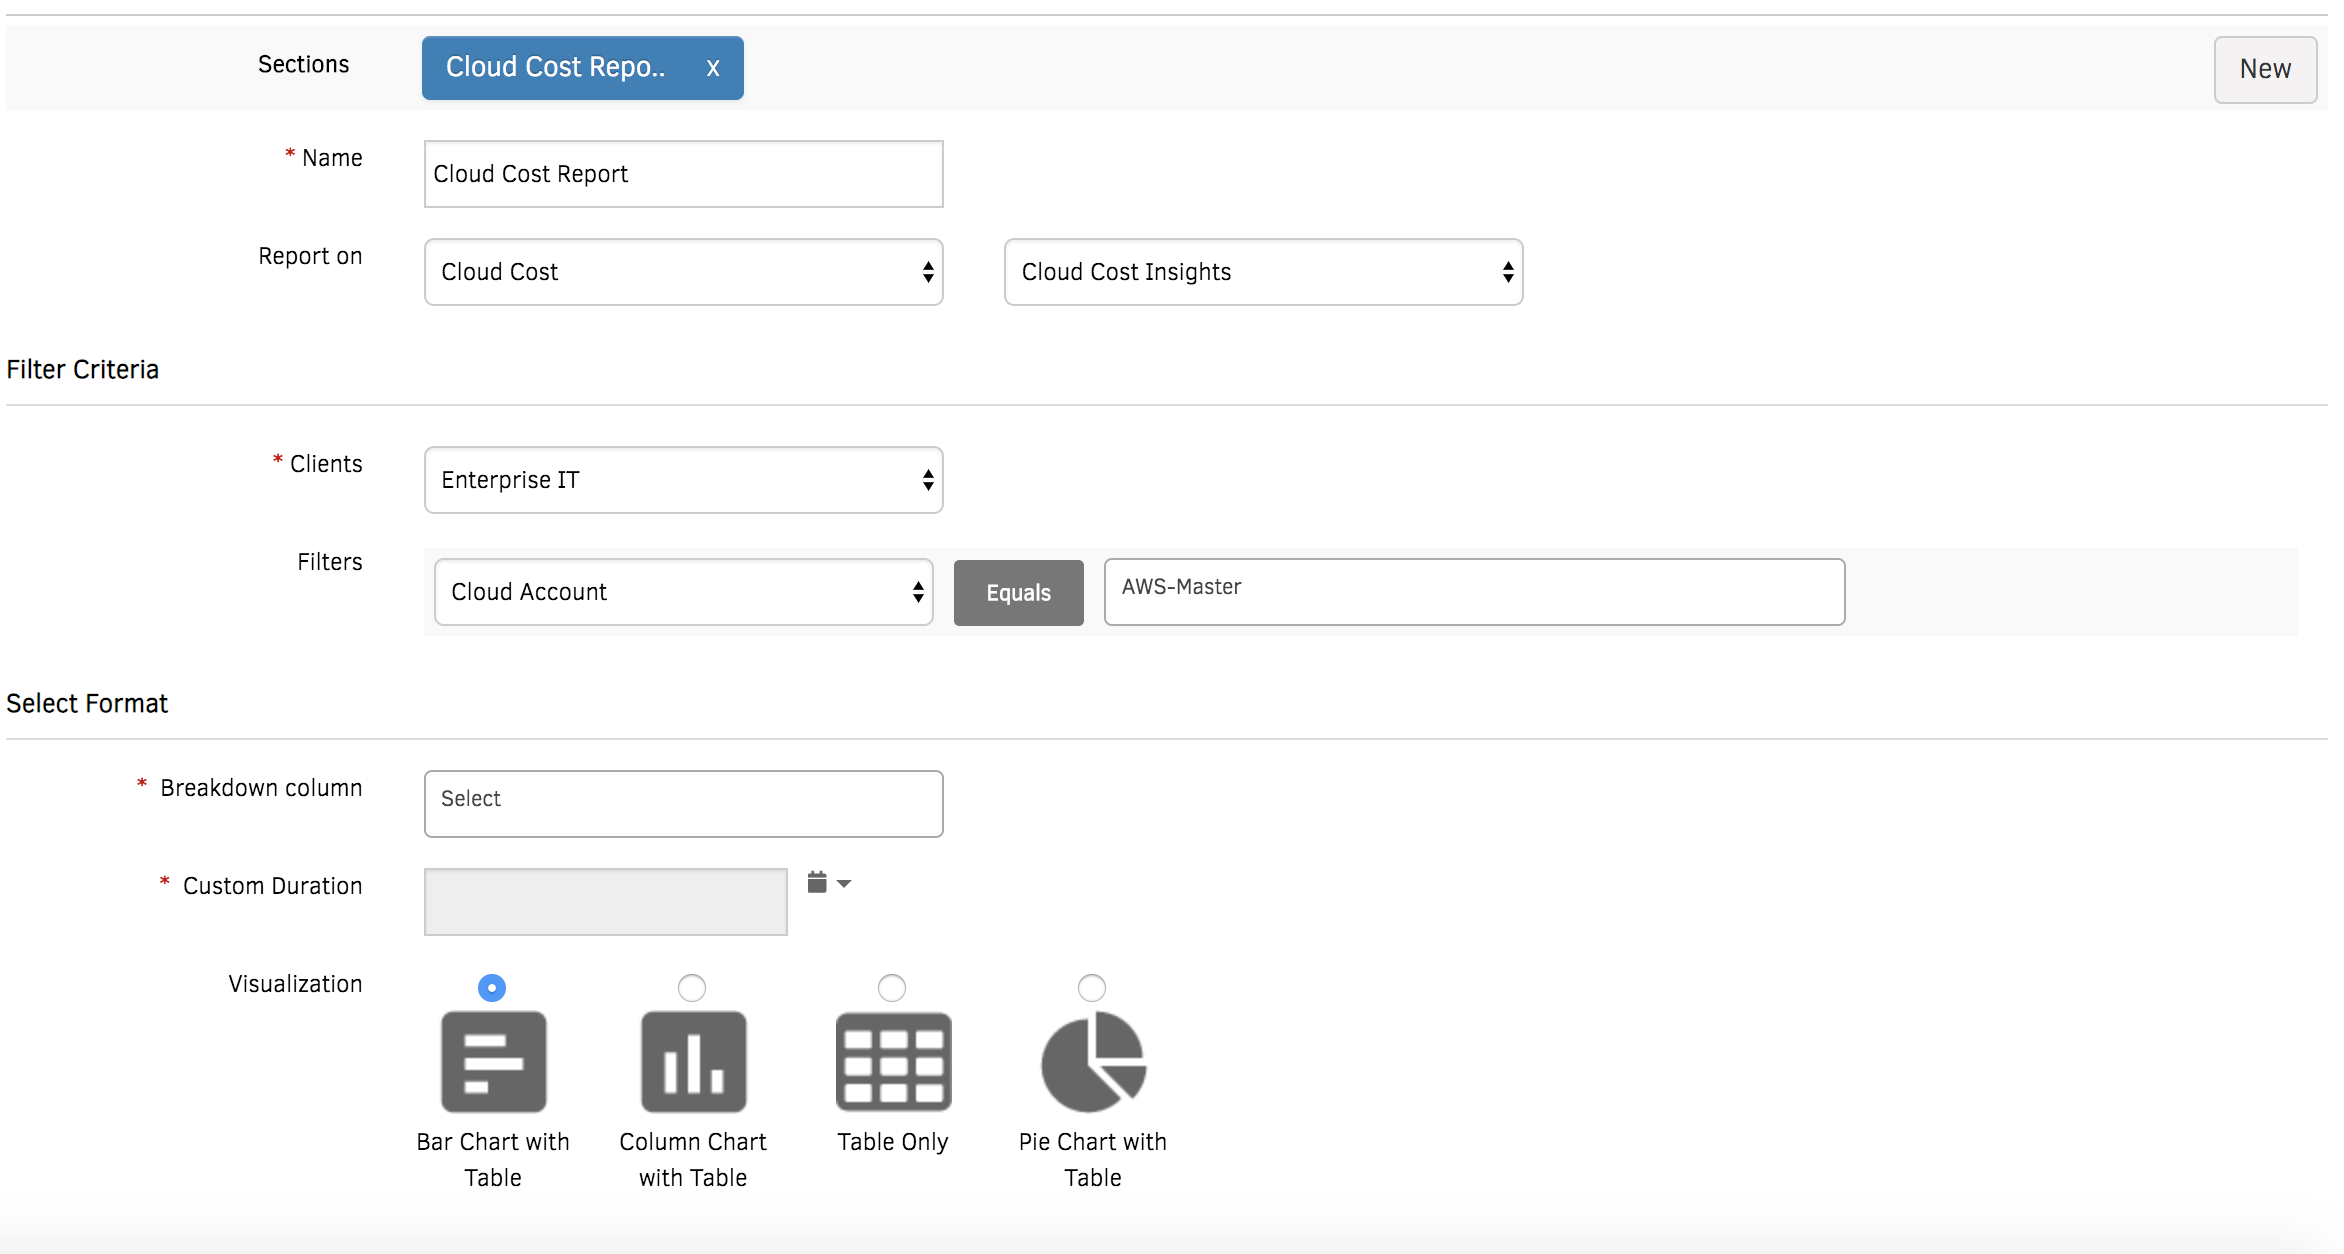
Reports are a great way to consume all the detailed operational metrics that OpsRamp collects. Our reporting enhancements for Alert Management provide you with summarized charts for alert trends and let you understand which resources generate the most noise. Our Cloud Cost reports offer the latest consumption trends for an organization, cloud provider, cloud account, region, and resource type.
Synthetics
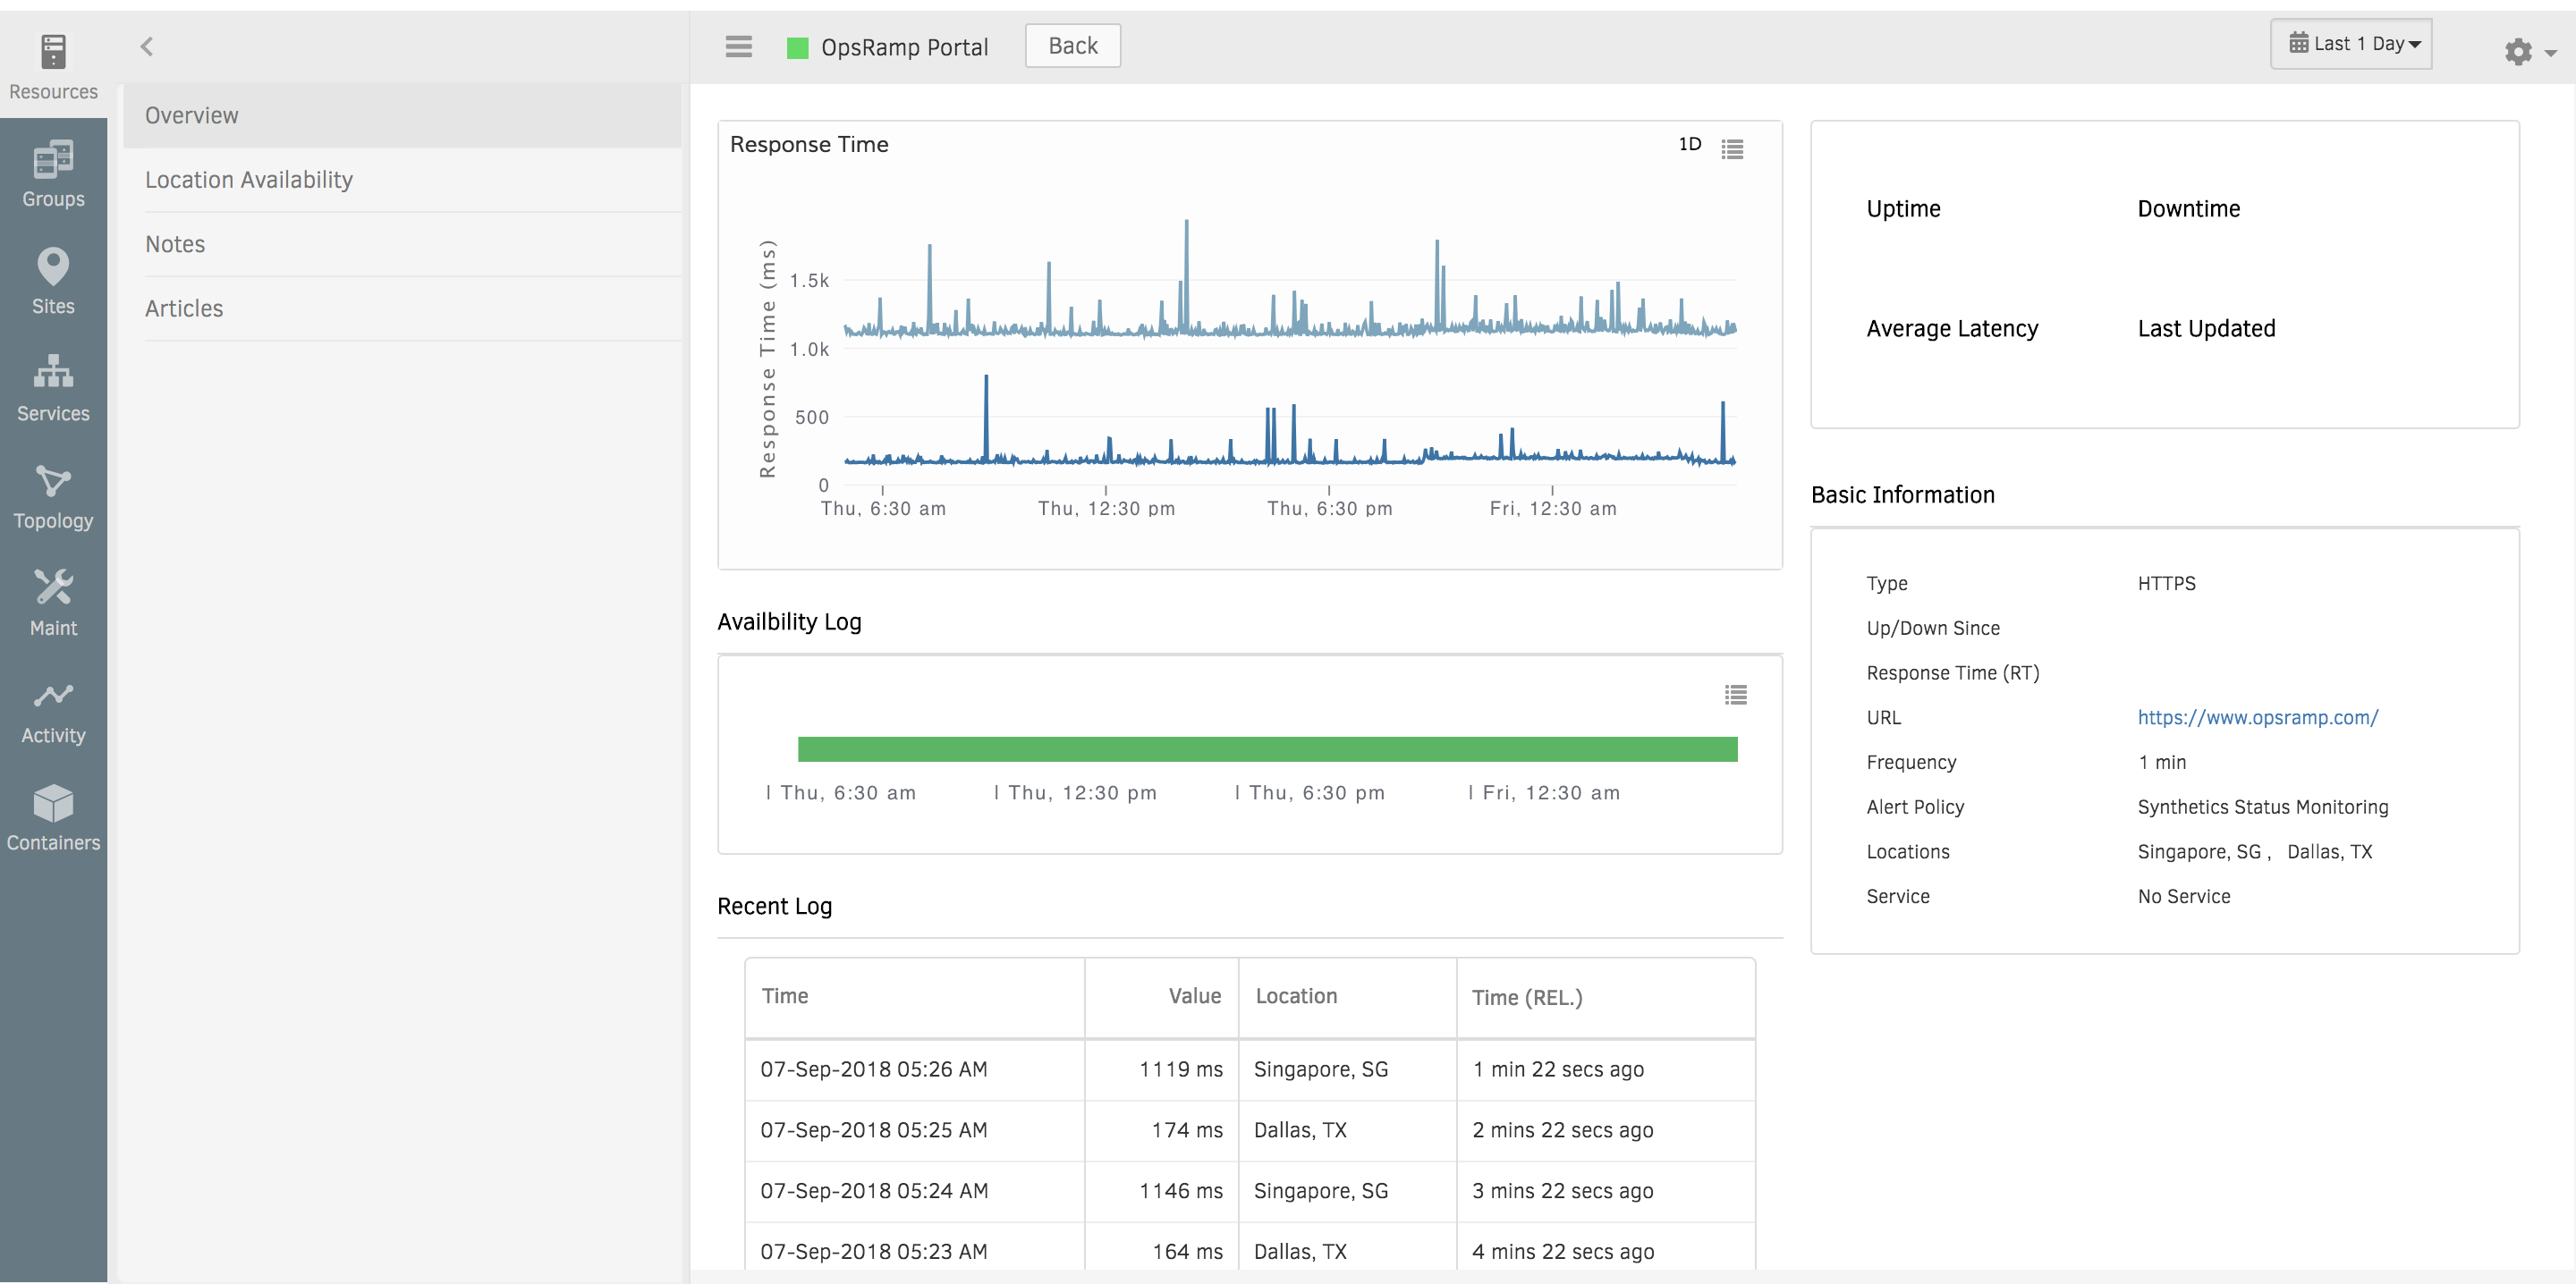
Our synthetics now lets you monitor the end-to-end email deliverability process, so that you are immediately notified about delayed or lost emails. We also offer eight geographic locations (we just added Mumbai) to track the availability and performance of your web apps at regular intervals. Finally, we’ve made it easier to configure and track your internal sites with synthetics, so that you can keep your IT services up and running at all times.
ServiceNow CMDB Integration
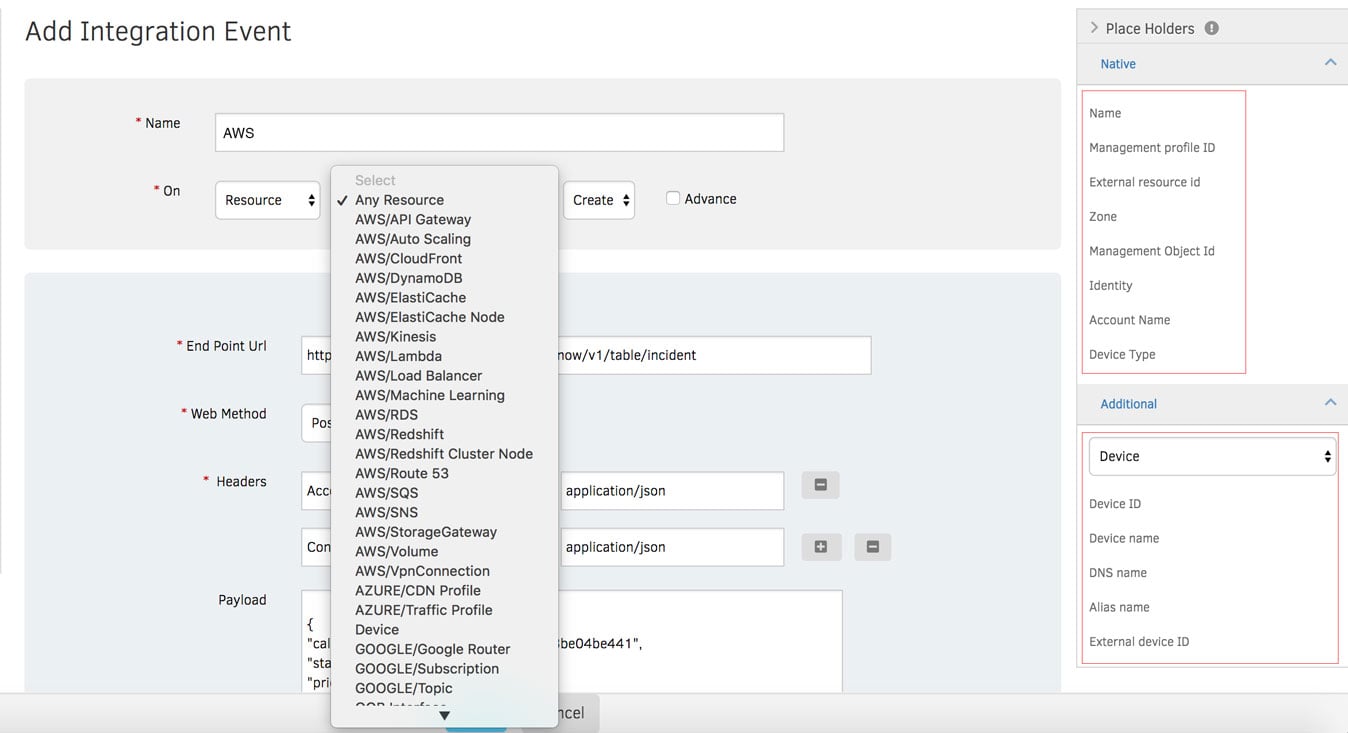
How do you keep the data in your ServiceNow CMDB from going stale? Our integration ensures that your ServiceNow CMDB is current with all the latest changes in your IT environment. You can gain continuous visibility into your dynamic IT assets and enrich your CMDB system with OpsRamp's live asset inventory feeds.
Check out our webinar recording for use case demos of our Fall 2018 features. You can also access the webinar slides which showcase the operational benefits and product roadmap for our platform.
