


For decades, compute or server infrastructure has been the backbone of the IT world. Compute has gradually evolved from on-premise hardware to programmable compute in the form of software containers. Technology operators need to constantly monitor the performance of their Windows, Linux, and container infrastructure so that they can optimize their compute environments to match workload demands.
OpsRamp’s server monitoring capabilities include both agent-based and agentless techniques for delivering performance insights for analysis and remediation. This blog covers server monitoring use cases across Windows, Linux, and containers, with details on metrics, alerts, incidents, reports, and dashboards.
Windows
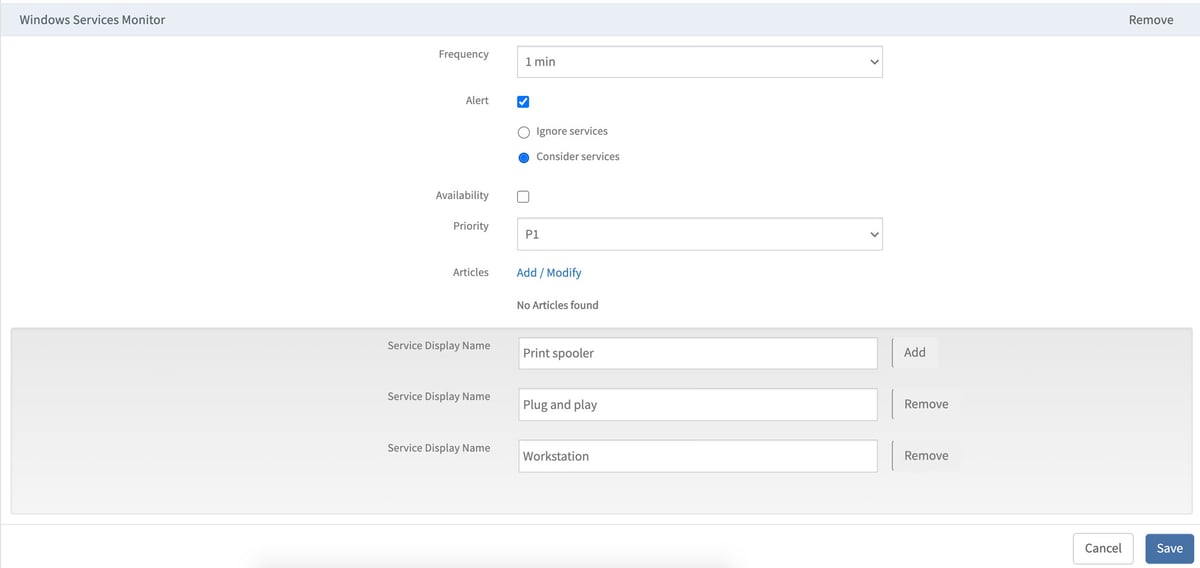
Service Monitoring. Different services are used to start, disable, and stop the functioning of the Windows operating system (OS). Service monitoring discovers Windows OS services, sends out alerts when a service stops functioning, and restarts a service using runbook automation. Users can also start and stop Windows OS services from the OpsRamp UI based on their existing access privileges.
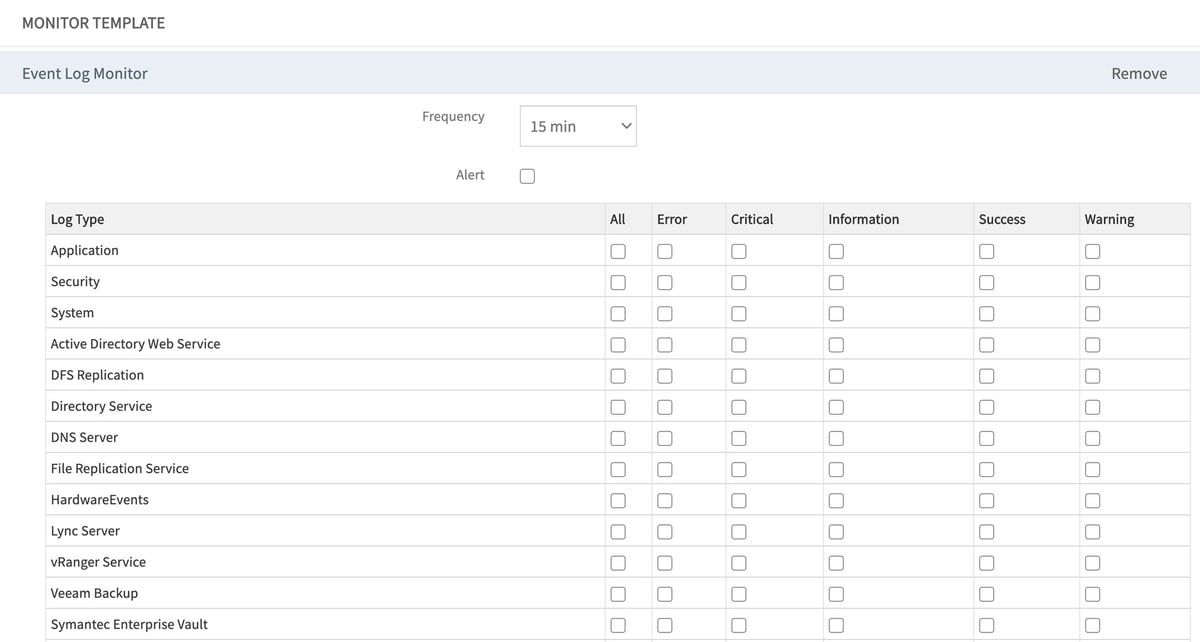
Event Log Monitoring. Event logs track the performance of custom applications, operating systems, and infrastructure in a Windows Server environment. Event log monitoring provides predefined sources as well as options to define sources for event logs and the ability to include or exclude event ID’s and messages for monitoring.
Linux
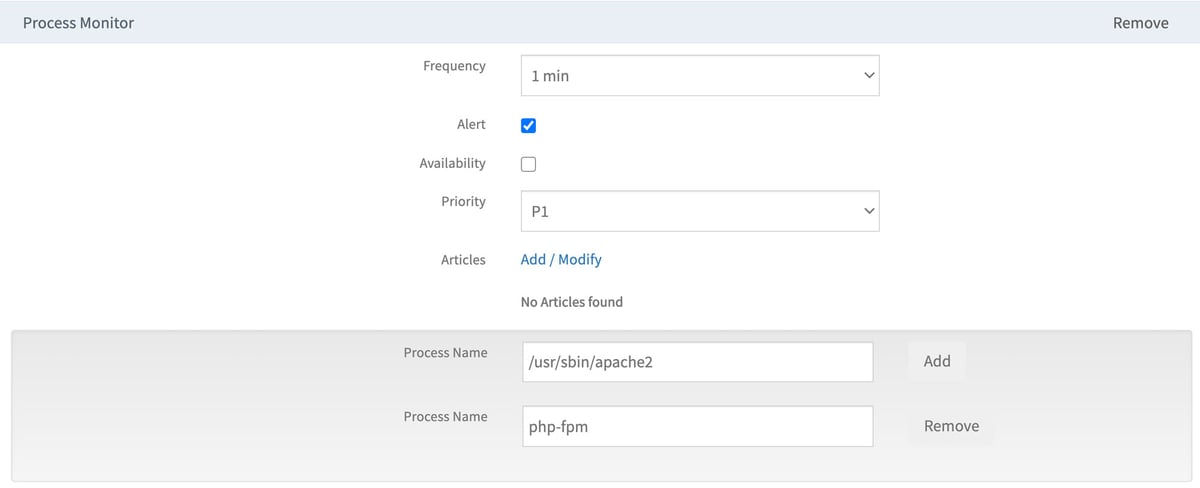
Process Monitoring. Linux processes manage the performance of business-critical workloads and underlying compute instances. Process activity monitoring aggregates CPU and memory utilization metrics for dynamic insights on CPU-intensive processes.
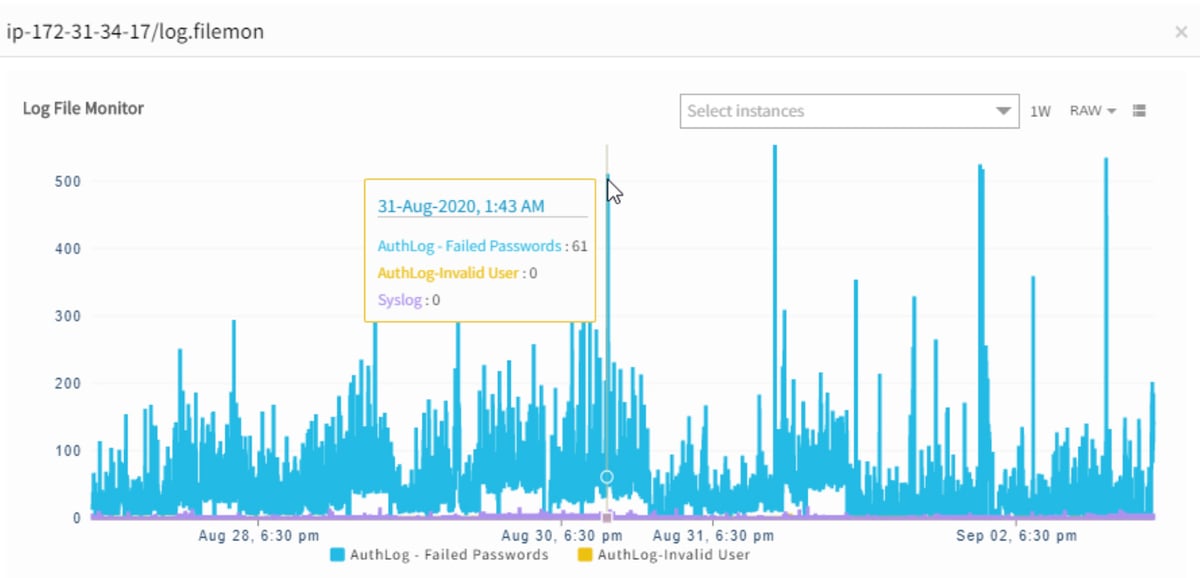
Syslog Monitoring. OpsRamp captures system-level log errors to handle performance bottlenecks and address systemic vulnerabilities across Linux servers.
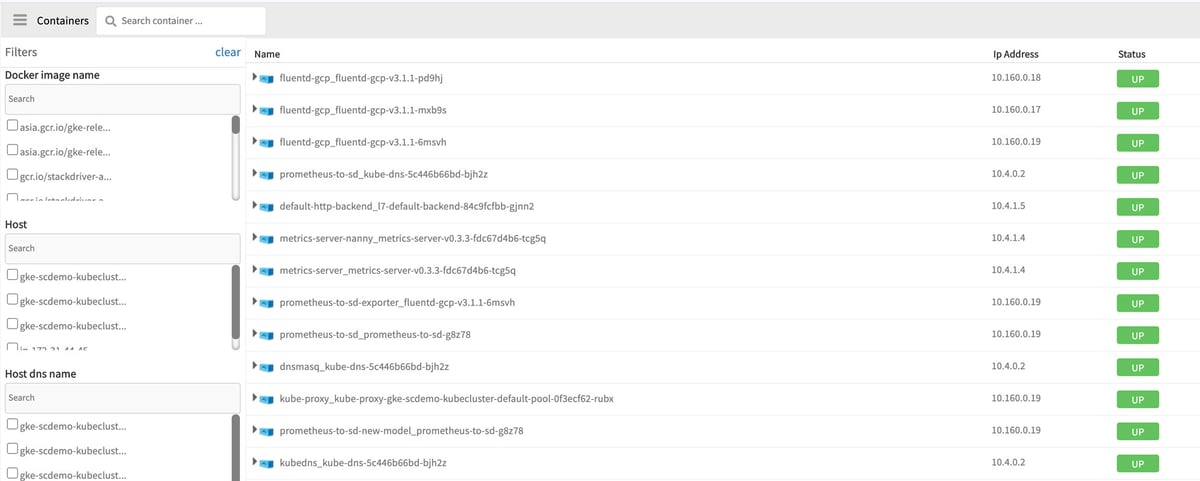
Container Monitoring. OpsRamp can monitor individual Docker hosts and Kubernetes clusters across on-prem and multi-cloud environments. Native Linux agents and K8s agents discover and monitor the performance of hosts across clusters, pods, images, namespaces, host DNS, daemon sets, replicasets, and services.
Metrics. IT teams can use out-of-the-box monitors to capture and visualize performance metrics across different versions and distributions of Windows and Linux operating systems. Here are some of the standard OS metrics that OpsRamp tracks across Windows and Linux distributions:
| Metric | Description |
| CPU Utilization | Overall system CPU usage in % |
| Disk Utilization | Free disk information in GB |
| Disk Utilization (%) | Overall system disk usage in % |
| Freedisk | Freedisk information in MB |
| Memory Utilization | Overall system memory usage in MB |
| Memory Utilization (%) | Overall system memory usage in % |
| Uptime | Uptime value in minutes |
Alerts. Alerts help notify IT operators of threshold violations or performance degradations across compute infrastructure. Monitoring policies sample performance data at one-minute intervals and generate alerts based on historical and real-time analysis.
Incidents. IT teams can escalate alerts into incidents or notifications using email, text, and voice so that on-call technicians can promptly troubleshoot and resolve issues.
Reports. OpsRamp analyzes availability, health, and performance data to generate scheduled and on-demand reports for application owners, infrastructure operators, and executive teams. Reports bring insights into capacity utilization for compute environments and help IT teams better plan for seasonal and cyclical trends.
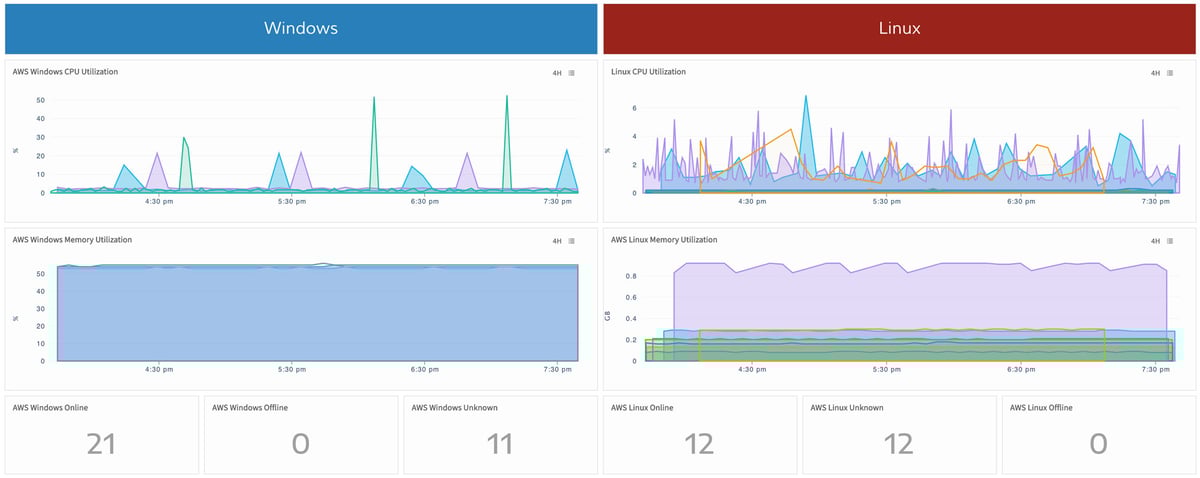
Dashboards. OpsRamp offers multiple dashboards and widgets that help IT operations teams better understand how their server environments are functioning.
OpsRamp captures, aggregates, and showcases critical availability and performance metrics for server infrastructure across on-prem and cloud. Metrics, alerts, incidents, reports, and dashboards help IT operations teams analyze the health of their technology services and their underlying compute instances in a single place.