

As distributed, interconnected microservices have replaced monolithic applications, application monitoring has had to evolve to support these modern, complex architectures. Rather than monitoring a single application and code base, organizations need to monitor the performance and network connectivity of multiple services that interact with each other.
To meet this need, OpsRamp, a Hewlett Packard Enterprise Company, now supports distributed tracing, providing better visibility into how applications and services interact with each other internally to handle a request. Combined with existing support for log management and application and infrastructure metrics, OpsRamp now delivers full-stack observability of hybrid environments along with the AI-driven event and incident management and intelligent automation to take analyze and take action on this observability data.
What is Distributed Tracing?
As we mentioned above, modern application architectures rely on microservices that could be running on multiple servers, in multiple data centers or cloud environments. These microservices exchange requests to complete the function of the application. Distributed tracing technology monitors these service requests as they pass through a distributed system, identifying any latency issues or bottlenecks in service delivery.
How does OpsRamp Distributed Tracing Work?
OpsRamp’s distributed trace capturing allows you to analyze the end-to-end flow of requests and rapidly pinpoint performance bottlenecks. You’ll be able to better understand and visualize the dependencies between application services and their interactions, which is key to building and operating sustainable and dependable application services. Applications are instrumented using OpenTelemetry as the instrumentation library that generates telemetry data and Jaeger as the tracing tool that tracks service requests between applications and services. Agents are not used. Key features of OpsRamp Distributed Tracing include:
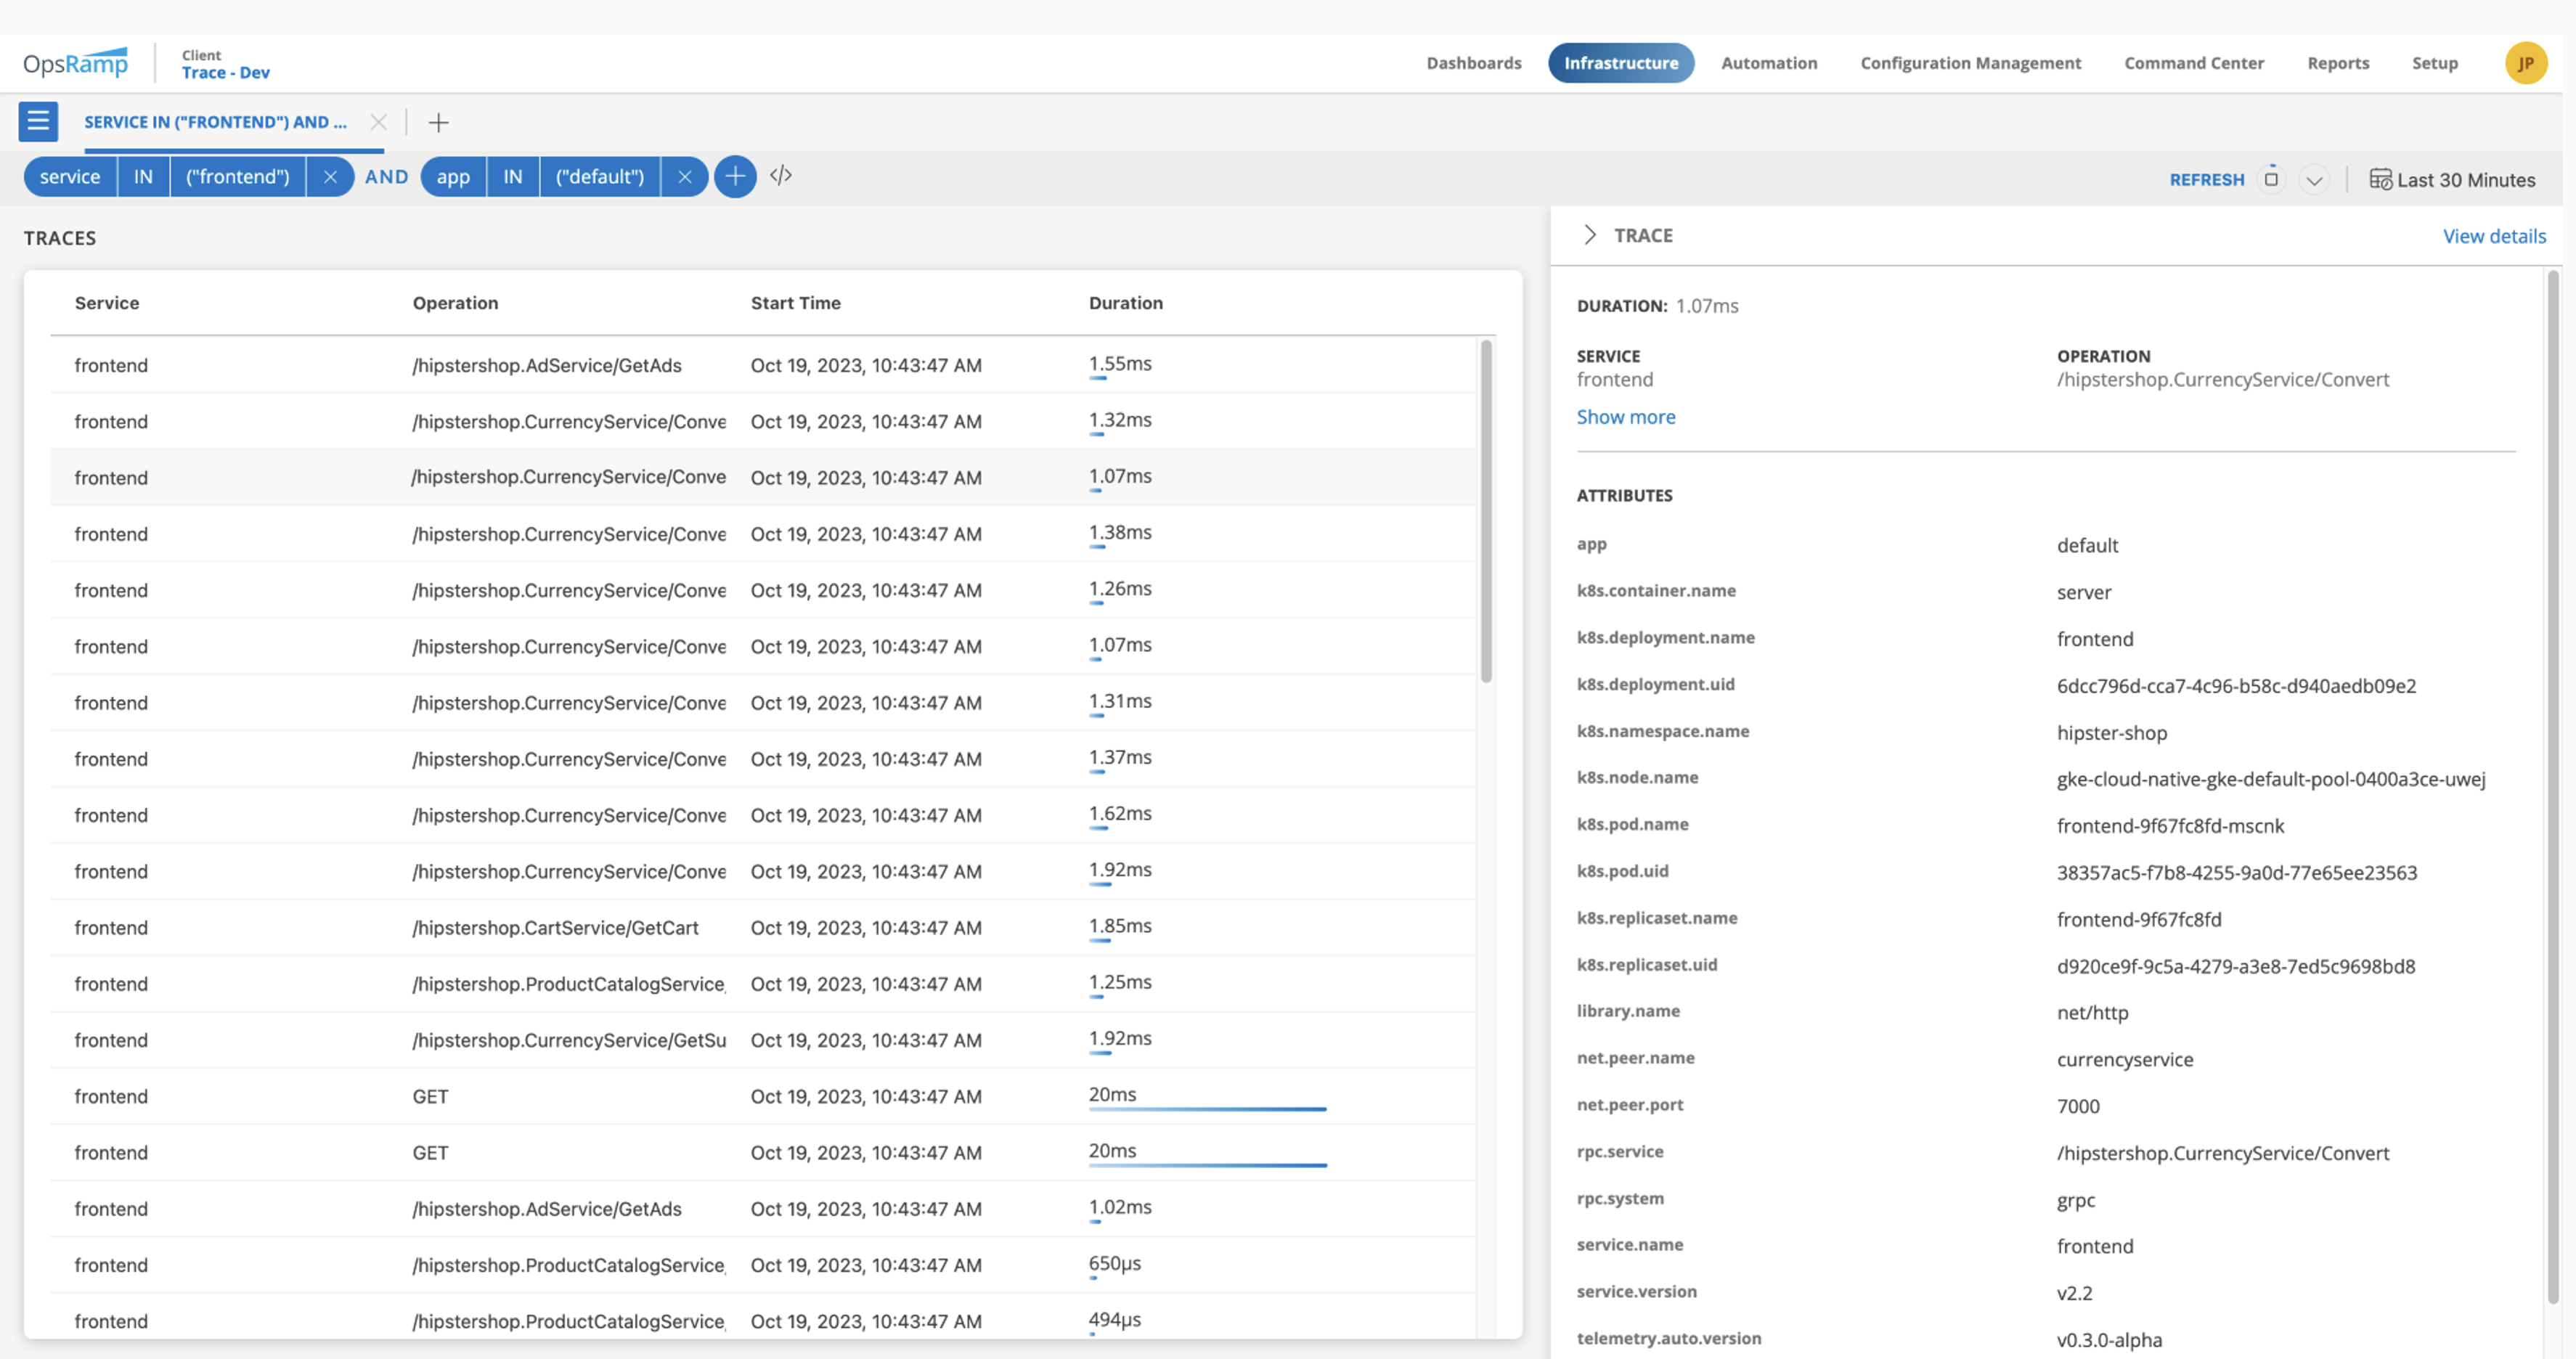
- Trace Explorer Console allows you to quickly and easily filter trace data that might need further investigation. Your teams can use Trace Explorer to view, sort and analyze specific trace data and drill down into the data for greater insights into root cause identification.
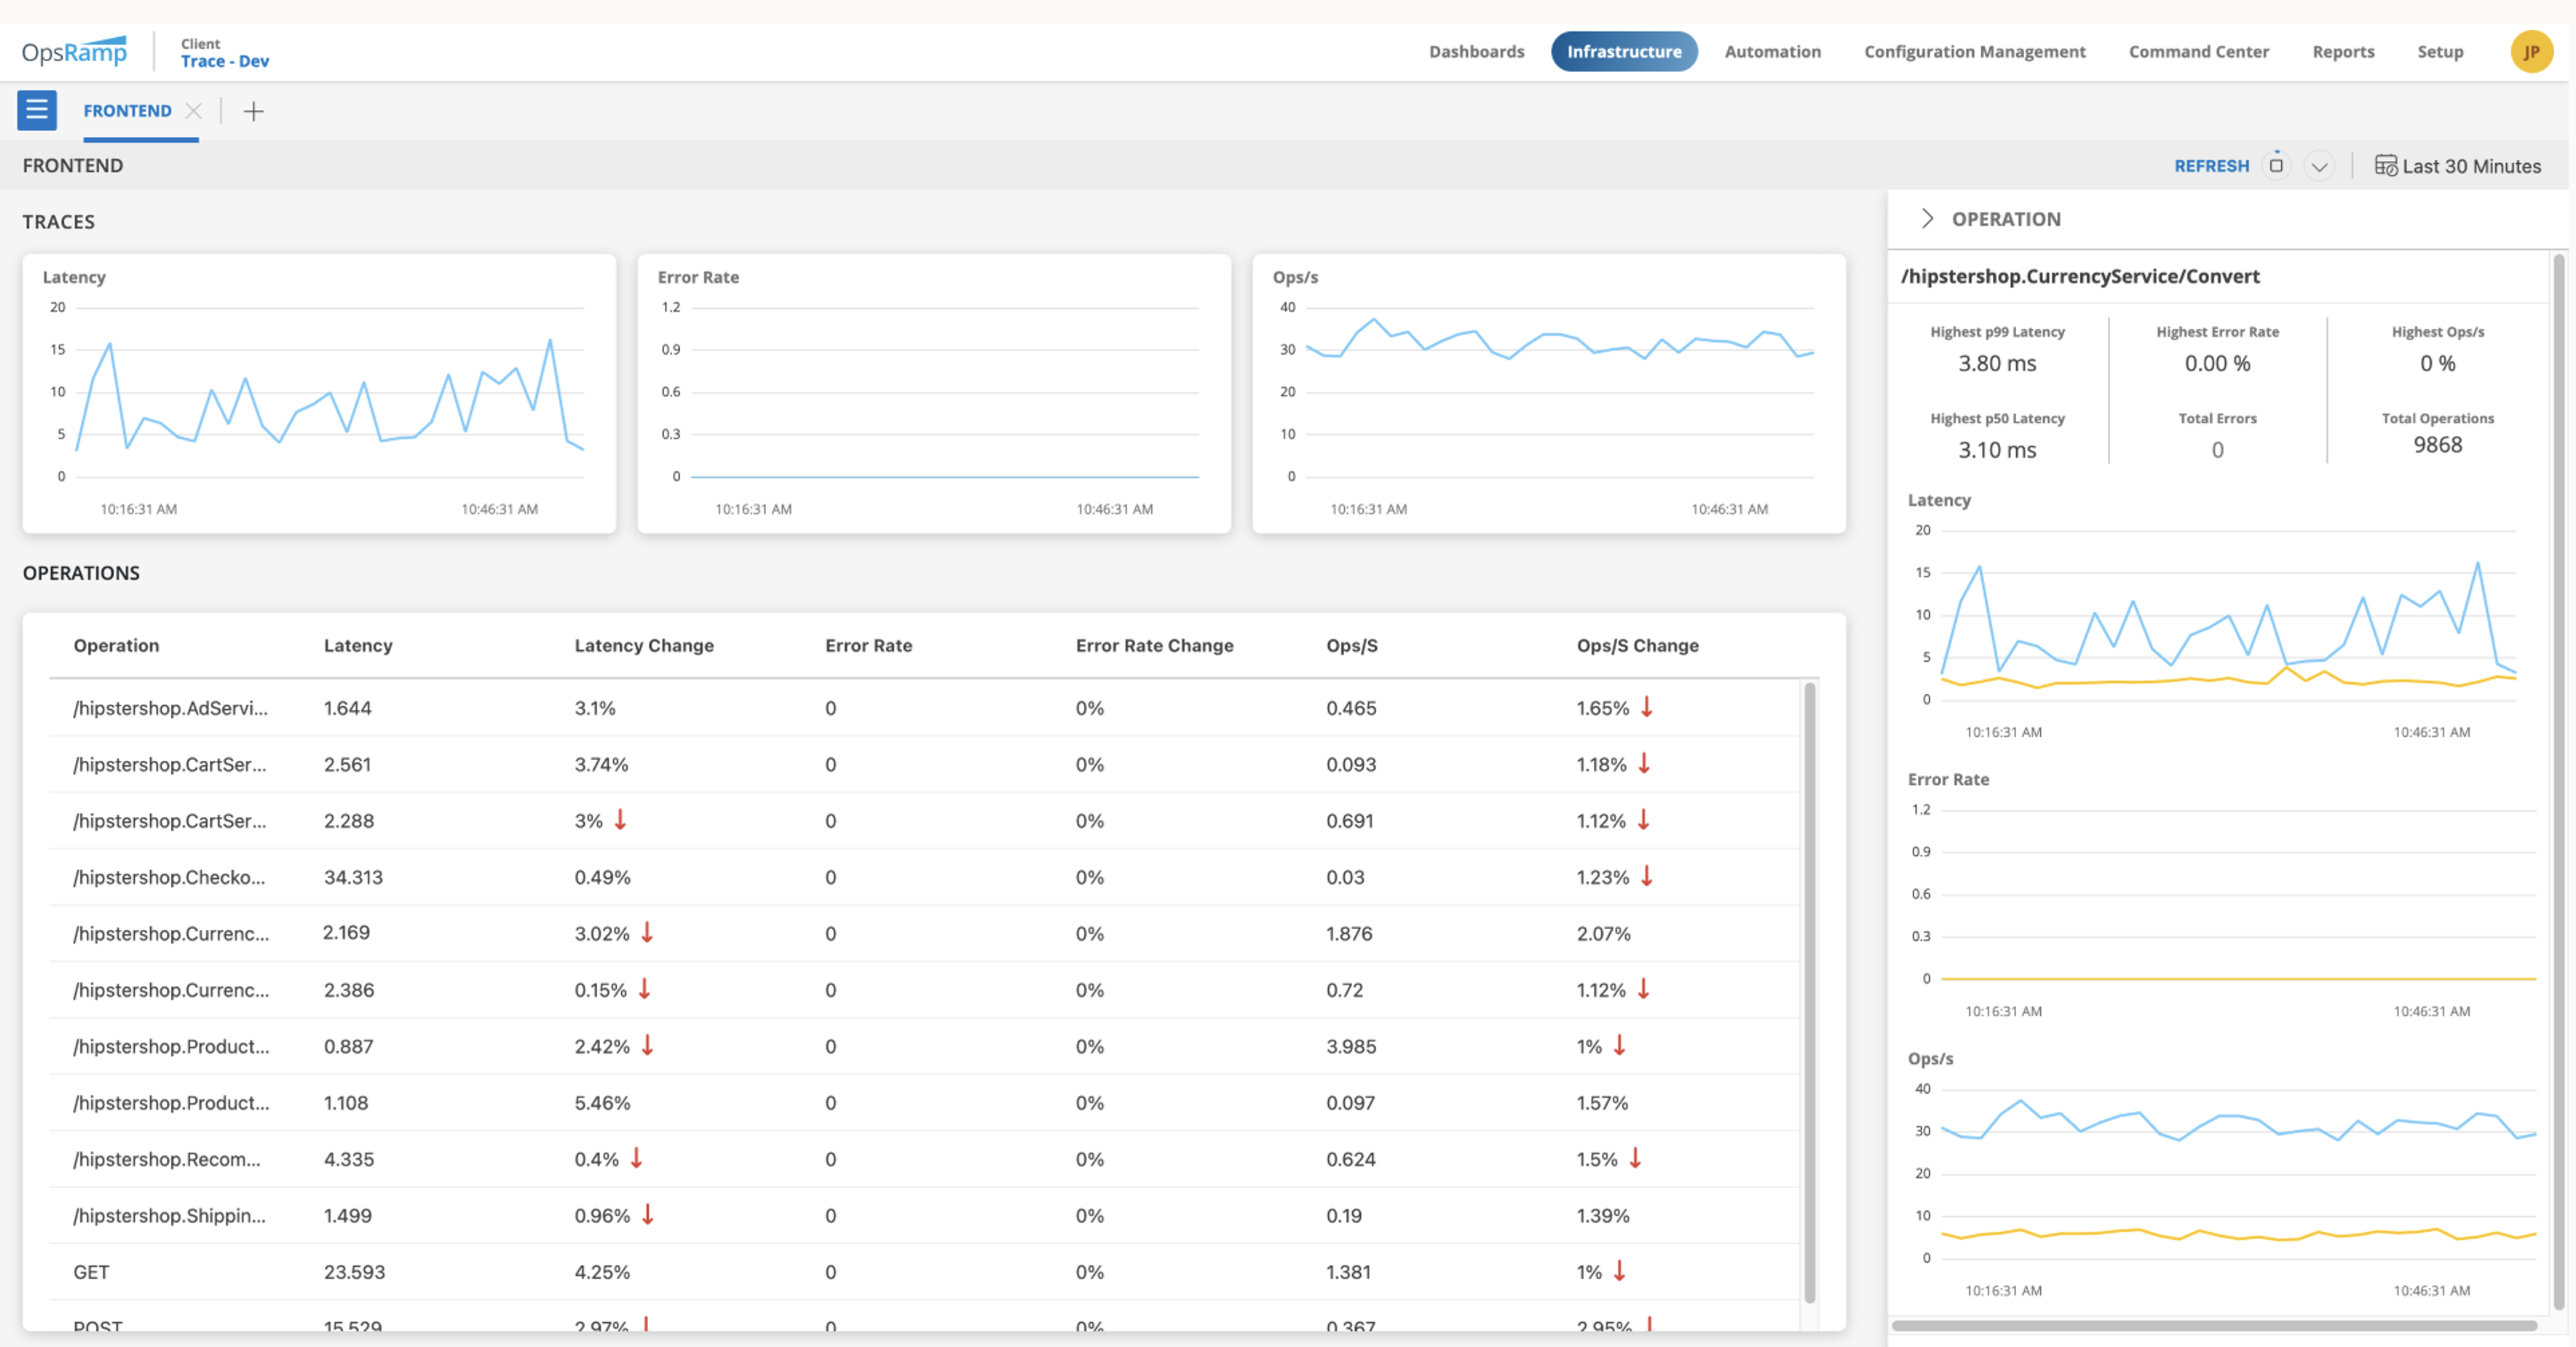
- Service Overviews provide deeper insights by capturing the ‘Golden Signals’ for specific application operations. You can drill down to the error traces to more easily and quickly identify potential bottlenecks affecting the performance of your applications.
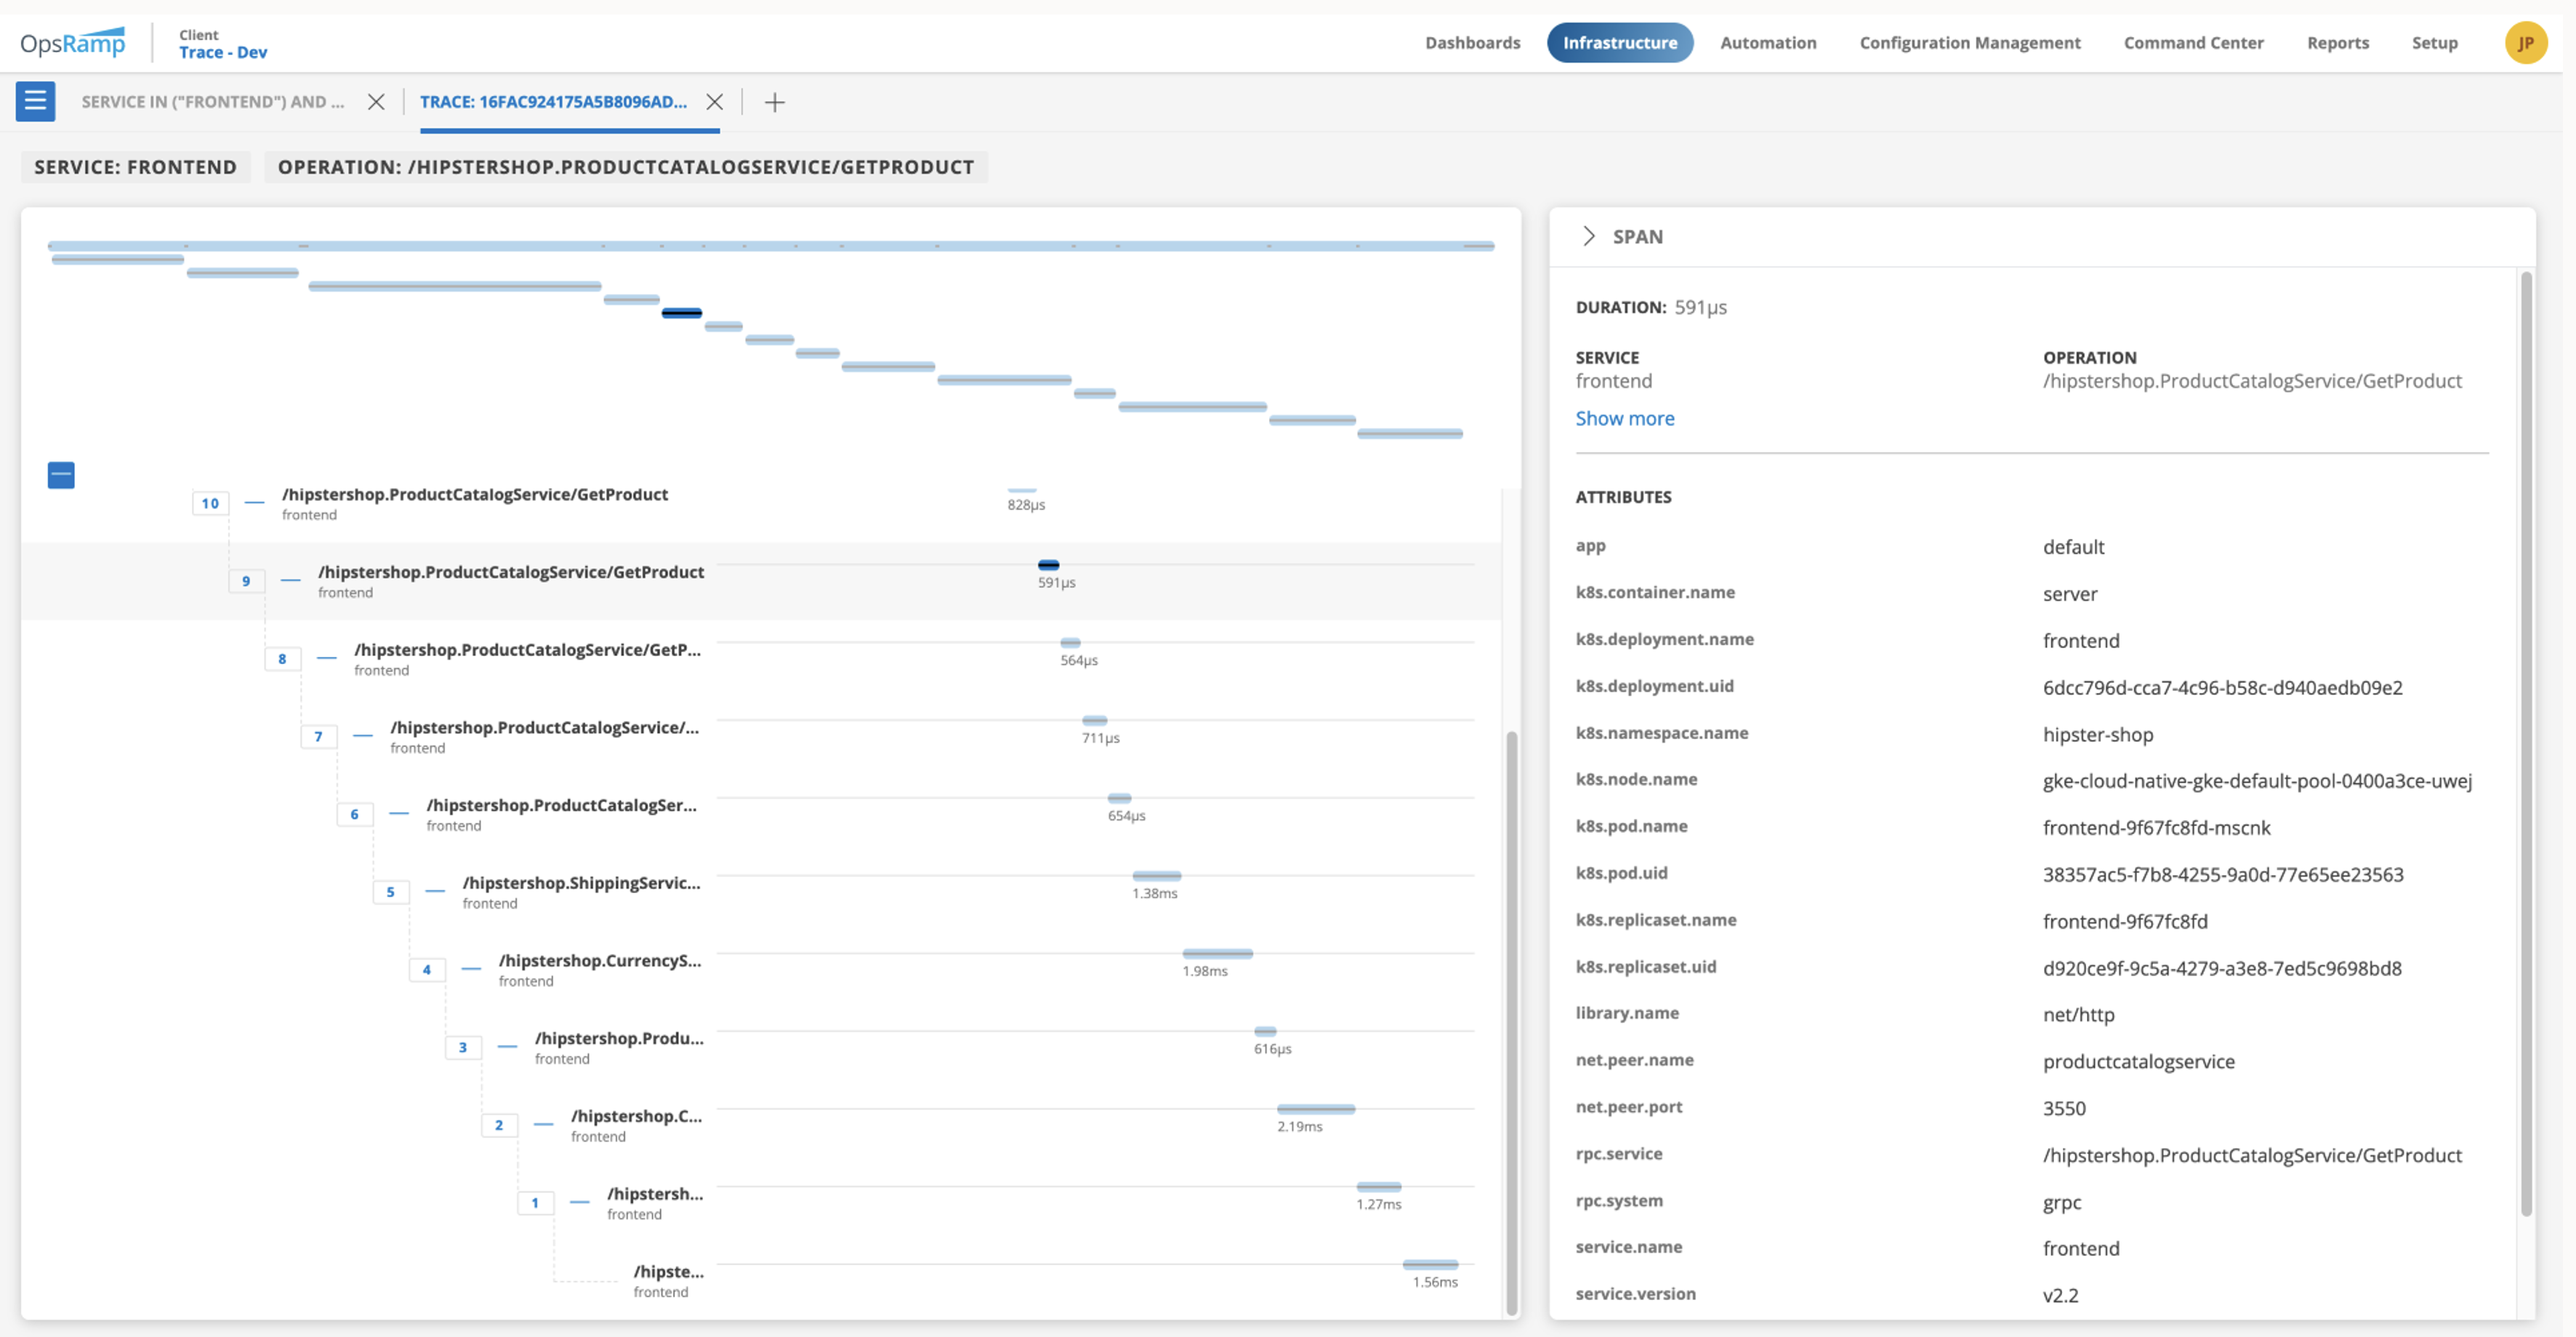
- Flame Graph View allows you to gain operation level visibility as well as access a range of attributes for specific services and operations. A combined view of your service and operational data allows you to identify the precise operation – within the larger service umbrella – that needs attention and resolution, eliminating wasted time spent reviewing each operation’s data point.
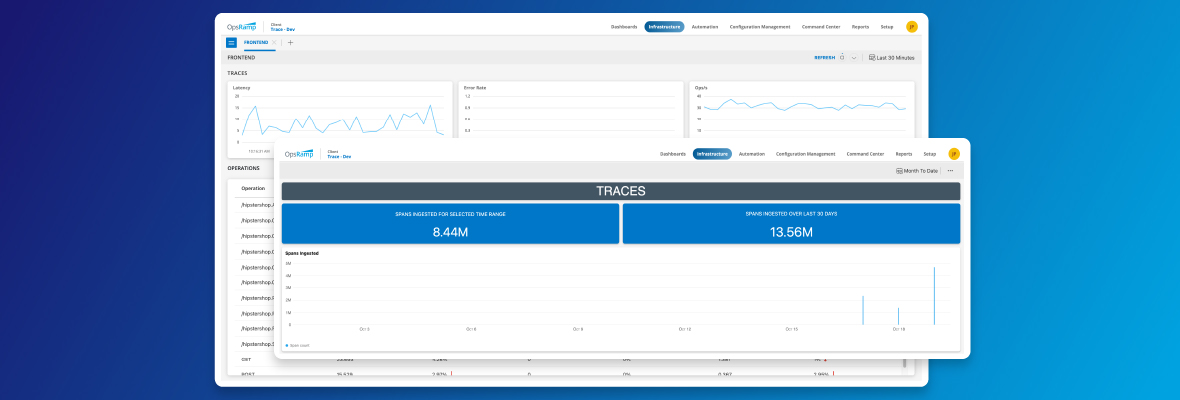
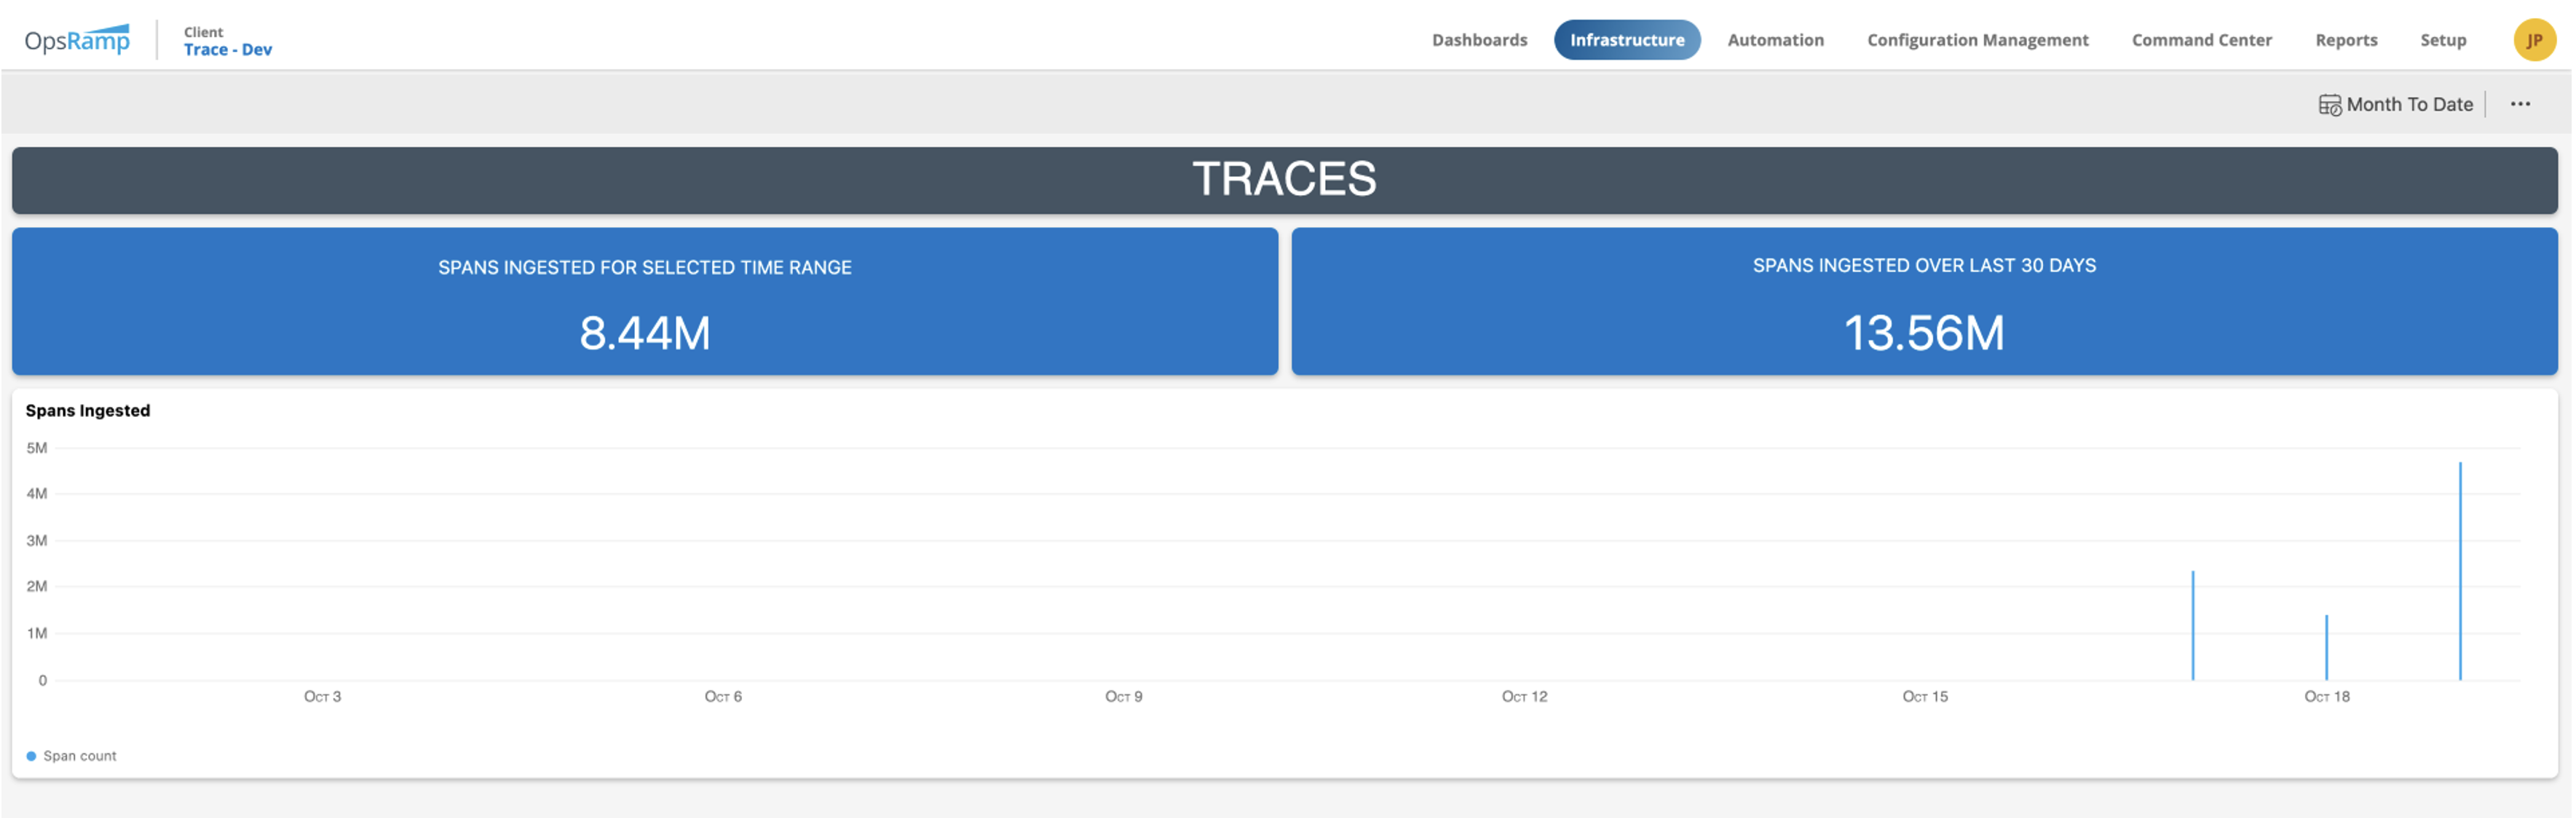
- Real-time usage-detail views of the trace data you’ve consumed over the last 30 days or any specified time-period.
Closing the Loop on Full Stack Hybrid Observability
Collecting and analyzing your application’s interactions with underlying services is critical to identifying and resolving true root causes of impactful events. OpsRamp’s ability to collect and contextualize metric, event, logs and trace data simplifies your effort in finding probable root cause at the infrastructure and application layers so you can drive faster return-to-service and a better customer experience.
Next Steps:
- Read the OpsRamp Trace Management Data Sheet.
- Read the blog: How OpsRamp Log Management Helps You to Find and Fix Issues Faster
- Learn more about full stack observability at OpsRamp
- Schedule a custom demo with an OpsRamp solution expert.
- Follow OpsRamp on Twitter and LinkedIn for real-time updates and news from the world of IT operations.