

How critical are open source applications for modern application and infrastructure modernization? Red Hat’s The State of Enterprise Open Source report found that more than two-thirds of IT leaders believe that open source software has a very important role to play in the enterprise and 59% of respondents expect to increase their use of open source in the next 12 months. Open source technologies are ubiquitous in the enterprise, across operating systems, business applications, databases, middleware, and infrastructure.
How do IT operations teams then discover, monitor, and optimize this diverse and growing ecosystem of open source apps? OpsRamp’s application adapters help business stakeholders, developers, and system administrators track the availability, health, and performance of more than 40 leading open source applications:
|
Category |
Technologies |
| Application Servers | Oracle Glassfish, Red Hat JBoss, WildFly |
| Big Data | Apache Hadoop |
| Cluster Managers | Apache Hadoop Yarn |
| Data Analytics Engines | Apache Spark |
| Distributed Computing | Apache Zookeeper |
| Enterprise Search | Elastic, Apache Solr |
| Event Processing | Apache Flume, Apache Kafka |
| Load Balancers | HAProxy, NGINX |
| Log Management | Fluentd |
| Message Brokers | Apache ActiveMQ, RabbitMQ |
| Relational Databases | MariaDB, MySQL, PostgreSQL |
| NoSQL Databases | Cassandra, CockroachDB, CouchDB, HBase, MongoDB, Neo4j, Redis |
| Web Servers | Apache Tomcat, Apache TomEE, Apache HTTP, Apache Jetty, Resin, Lighttpd |
Maximize the Uptime and Availability of Business-Critical Applications
OpsRamp ensures the availability of open source apps using agent-based and agentless approaches and delivers rapid root cause(s) analysis for performance issues with intelligent correlation. Agent-based monitoring offers granular metrics for application health visibility and dependency mapping for real-time impact analysis while agentless monitoring enables the quick collection of application performance metrics without any management overhead.
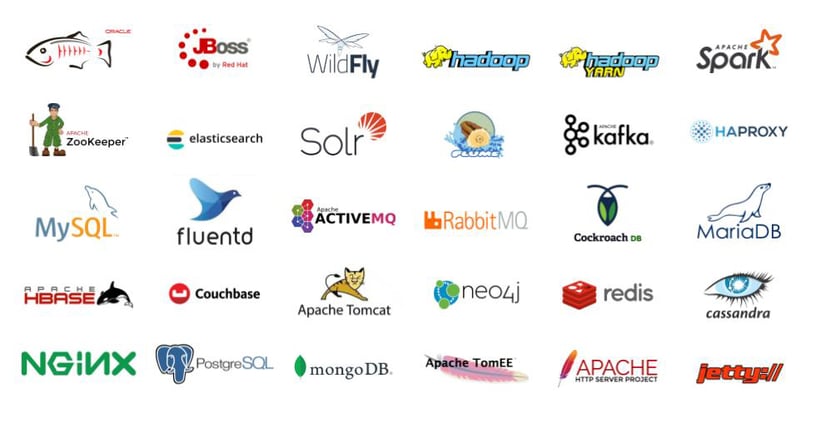
Figure 1 - Monitor the availability and performance of open source web servers, databases, message brokers, load balancers, data analytics engines, and enterprise search platforms.
Let us take a look at how you can monitor the performance of five popular open source apps with OpsRamp’s application adapters:
- Apache Cassandra. Cassandra is a high-performance NoSQL database that can handle large volumes of mission-critical data. OpsRamp helps database administrators maintain the health of their Cassandra clusters with performance metrics on read/write latency, disk usage, client request latency, thread pool information, JVM heap and non-heap memory, and JVM threads. Technology teams will not only be able to identify sluggish database instances quickly but also receive instant alerts for performance issues in Cassandra nodes and clusters.
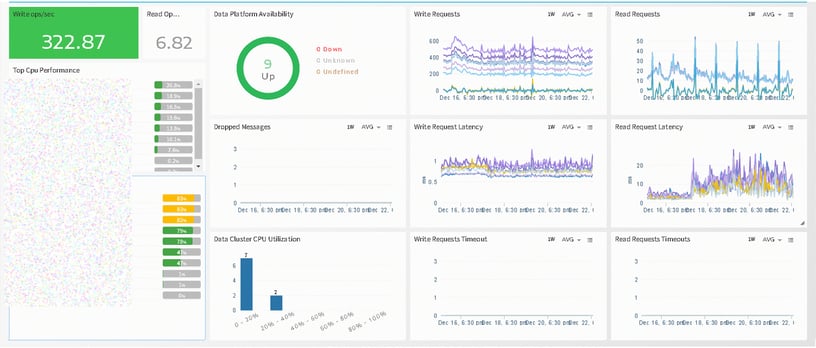
Figure 2 - OpsRamp dashboards deliver Cassandra performance insights in a single place.
- Elasticsearch. Elasticsearch is an enterprise-grade search engine that enables rapid information retrieval across textual, numerical, geospatial, structured, and unstructured data. OpsRamp helps maintain the health of Elasticsearch deployments with performance metrics on node and cluster health, search and indices, and heap usage and garbage collection. IT teams can quickly pinpoint underperforming Elasticsearch nodes and clusters before they negatively impact customer experience.
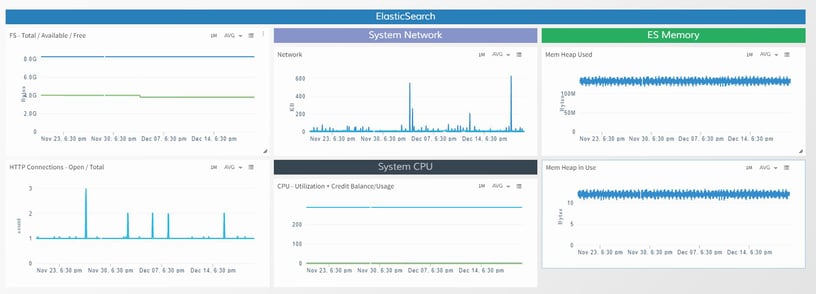
Figure 3 - Manage the availability and performance of Elasticsearch clusters, shards, and nodes with OpsRamp.
- Apache Kafka. Kafka is an event streaming platform that can publish, store, and process huge volumes of real-time data feeds. OpsRamp lets developers monitor their Kafka data pipelines with Kafka producer and consumer metrics, broker metrics, and JVM and OS metrics. IT operations teams can better manage resource utilization and performance of Kafka clusters with clear insights and consolidate lower-level system metrics for faster visibility into performance problems.
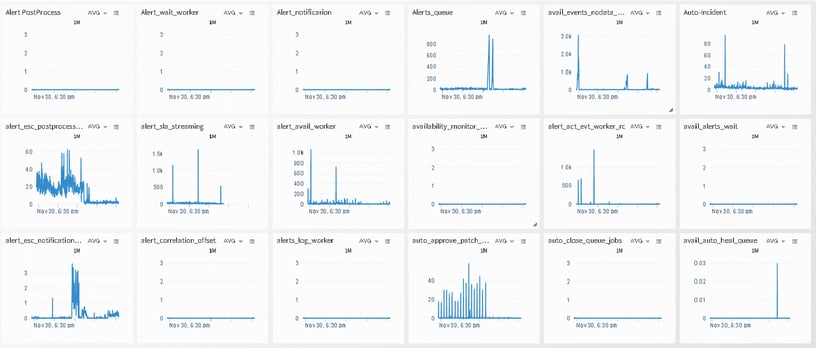
Figure 4 - Gain comprehensive metrics and alerts for Kafka clusters at production scale.
- MySQL. MySQL is an open source relational database management system that is the second most popular database in use today. OpsRamp optimizes the performance of MySQL databases with comprehensive metrics for server uptime, CRUD operations, and request, buffer pool, table, and connection stats. IT teams can gain unified insights into MySQL database-engine level health with relevant metrics, smart alerts, and out-of-the-box dashboards.
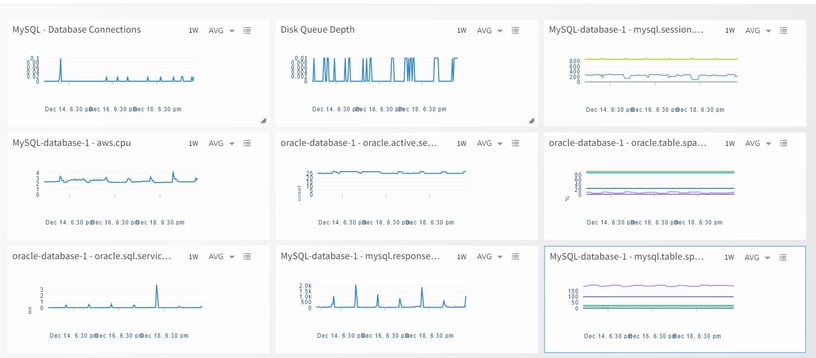
Figure 5 - Ensure the performance and resilience of MySQL database clusters with OpsRamp.
- Redis. Redis is an in-memory data structure store, used as a database, cache and message broker. OpsRamp ensures the performance of Redis instances with comprehensive metrics for server uptime, response time, replica status, and connection, memory and key stats. Developers can gain relevant insights into Redis clusters with performance dashboards on memory usage, uptime, latency, and throughput.
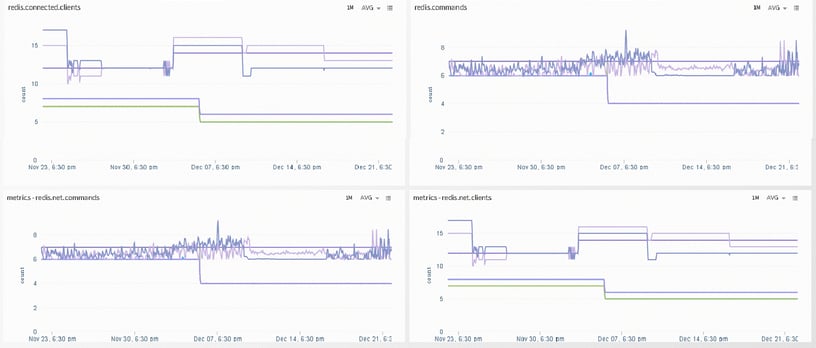
Figure 6 - Gain the right levels of visibility and control into Redis instances, clusters, and servers.
Next Steps:
- Learn more about OpsRamp Cloud Monitoring for AWS, GCP, and Azure workloads.
- Read about Virtualization Monitoring with OpsRamp.
- Schedule a custom demo with an OpsRamp solution expert.