

Hypervisor-based server virtualization is widely used in hybrid IT environments for better infrastructure utilization, improved disaster recovery, and considerable cost savings. Given the complexities involved in managing virtualized environments, IT teams need the right insights for virtual resource monitoring so that they can address performance issues quickly.
Here are some concerns that are top of mind for digital operations teams handling virtualized environments:
- Can you discover, monitor, alert, and remediate issues across virtualized resources in a single place?
- Can you access real-time performance and health metrics for virtual machines, hosts, and datastores for your enterprise?
- Can you visualize topology relationships across virtual machines, hypervisor servers, and clusters in VMware vSphere and KVM environments?
- Can you tame virtual machine sprawl and identify which virtual resources are consuming the most bandwidth?
Gain Visibility into Dynamic Virtualized Infrastructure
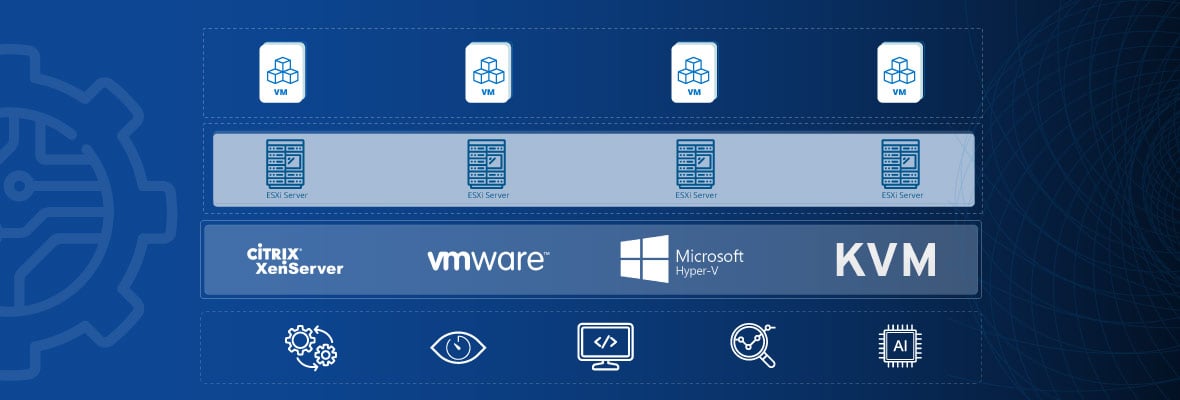
OpsRamp offers dynamic discovery, hybrid performance monitoring, real-time alerting and visualization for virtual machine bandwidth consumption for VMware, Microsoft Hyper-V, Citrix Xen, and KVM hypervisors. IT teams can not only access related performance insights for VMs, clusters, hosts, containers, and vSANs, but also use topology maps to understand the service and infrastructure dependencies for different virtualized infrastructure.
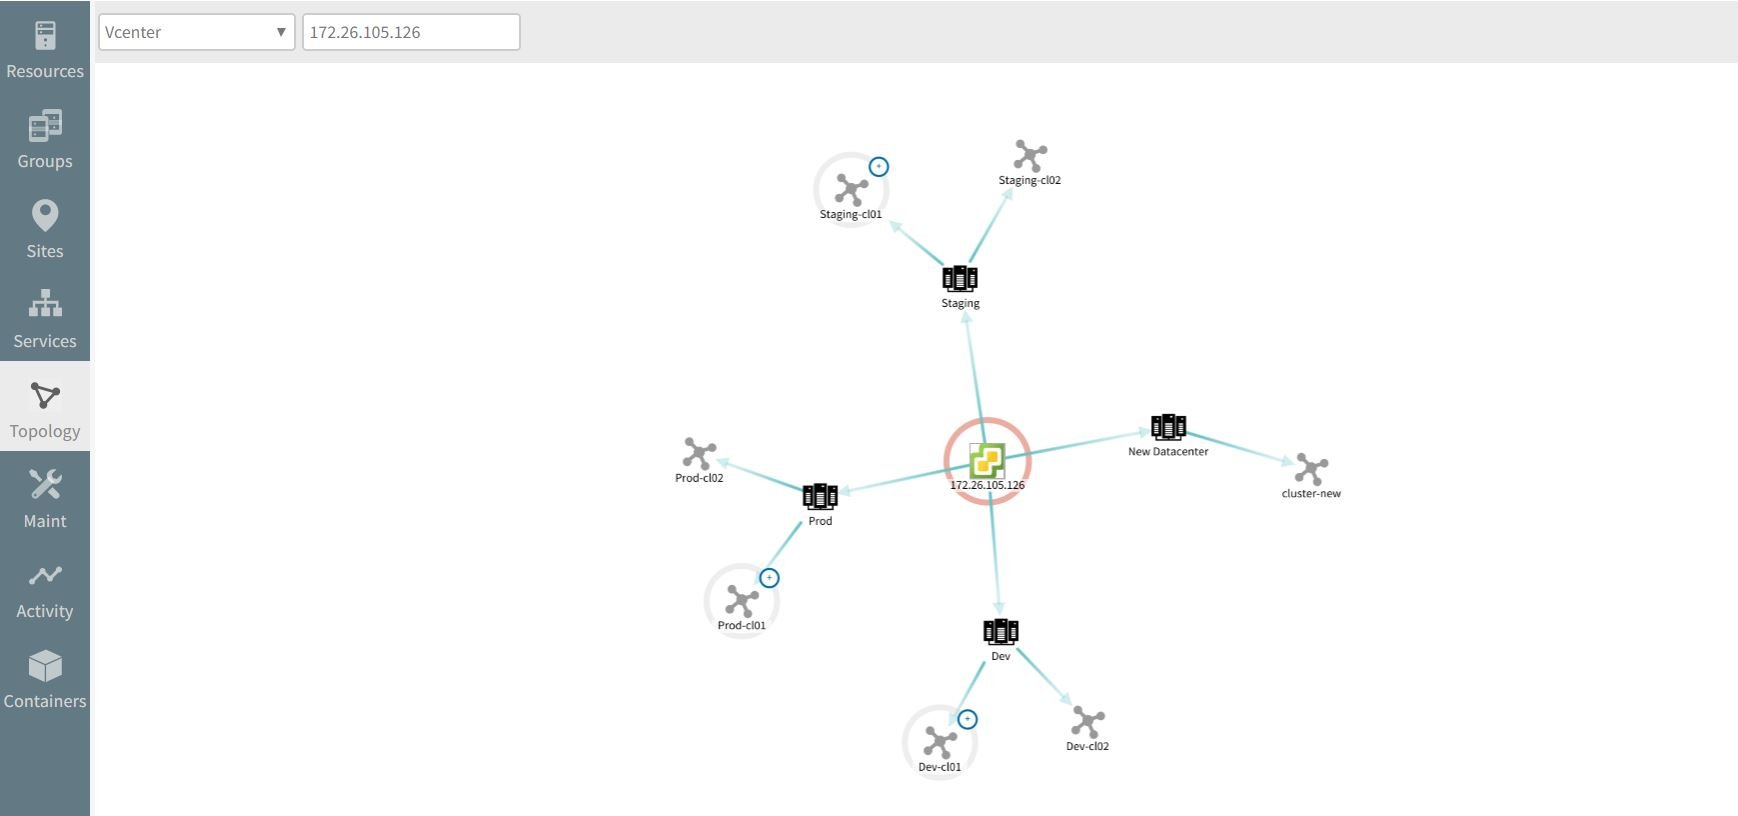
Figure 1 - See where your virtual machines are running and how they are connected.
#1 - VMware
IT teams can use the OpsRamp Gateway to onboard their VMware VCenter servers, ESX/ESXi hosts, and virtual machines via APIs. Administrators can add, edit, and remove different resources like virtual machines, hosts, datastores, and clusters and determine the health and performance of host servers and their corresponding virtual machines.
IT administrators can access detailed instructions for VMware Discovery in our product documentation. Upon successful discovery, IT teams can view the list of virtual machines that are present in each of the discovery profiles.
- VMware vCenter. The vCenter server is a centralized management application that manages virtual machines on a distributed virtual datacenter and ESXi hosts. With OpsRamp, administrators can view the entire list of hosted virtual machines and impacted resources along with related threshold breaches for virtualized environments.
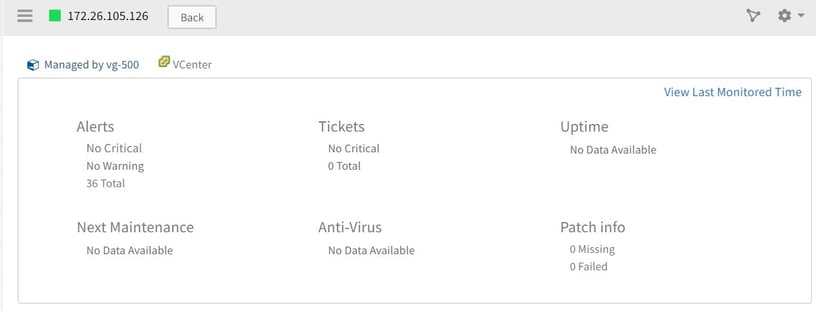
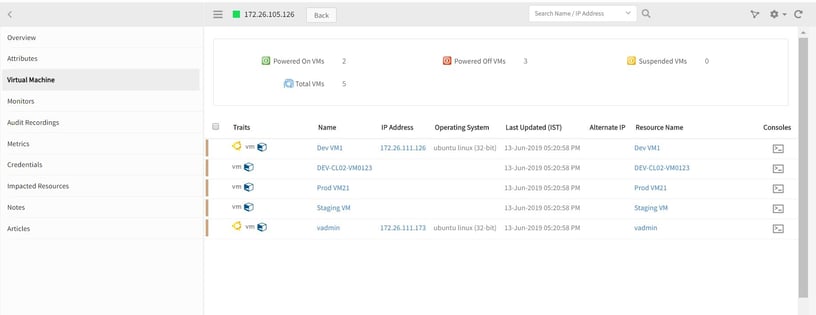
Figure 2 - Gain visibility into every tier of your virtual infrastructure with OpsRamp.
- VMware ESXi Hosts. OpsRamp provides detailed insights to monitor and abstract the performance of the processor, memory, storage, and networking resources for virtual machines running on ESXi hosts. IT operations teams can maximize ESXi server uptime and ensure that virtual machines in ESXi servers are running at peak performance using role-based dashboards and real-time alerting.
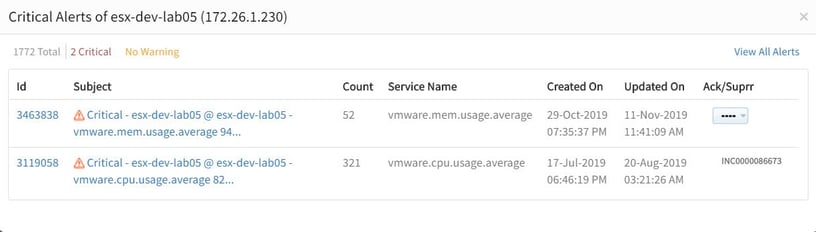
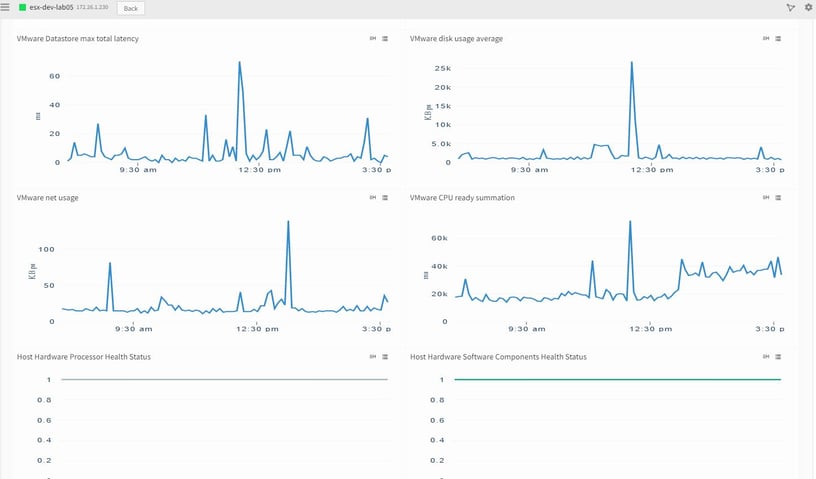
Figure 3 - Proactively detect and address performance issues in your VMware environment.
- VMware Datastore. Datastores are storage containers that offer a standard model for storing virtual machine files. OpsRamp discovers datastores as part of vCenter and ESXi discovery and tracks datastore performance with real-time insights on available capacity, unused capacity, read/write rates, and total provisioned disk space.
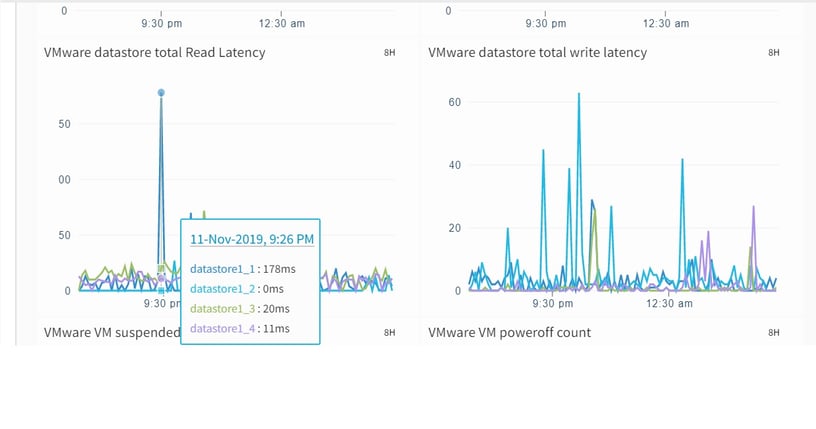
Figure 4 - Access relevant performance metrics for ESXi datastore monitoring.
#2 - Citrix XenServer
OpsRamp discovers, monitors, and optimizes the performance of Citrix XenServer virtualized environments. IT teams can access detailed instructions for configuring Citrix XenServer resources within OpsRamp. After adding Citrix XenServer resources to OpsRamp, IT pros can access detailed information on the impacted and dependent virtual resources.
IT teams can connect their Citrix XenServer infrastructure to the OpsRamp Gateway via APIs and gain a complete view of the availability and performance of XenServer health status, pool status, and storage checks.
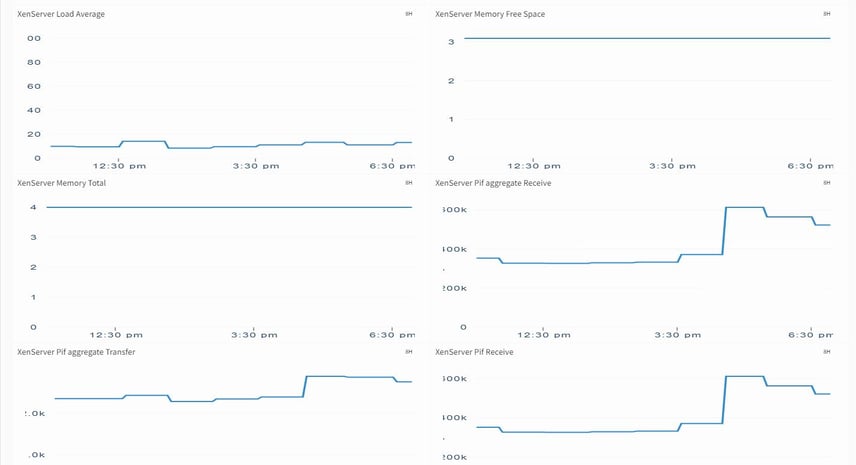
Figure 5 - Gain proactive monitoring capabilities for Citrix XenServer environments.
Next Steps:
- Visit the OpsRamp booth at the 2019 Gartner IT Infrastructure, Operations & Cloud Strategies Conference.
- Check out all our latest articles and press mentions in the OpsRamp newsroom.
- Follow us on Twitter, LinkedIn, and BrightTalk.