

In our first blog, we looked at the three key anatomies behind IT outages - outages due to capacity constraints, component failures, and human errors. In this post, we will review an approach to predict and detect different types of outages. The goal with each potential IT outage is to predict early and detect soon (see Figure 1).

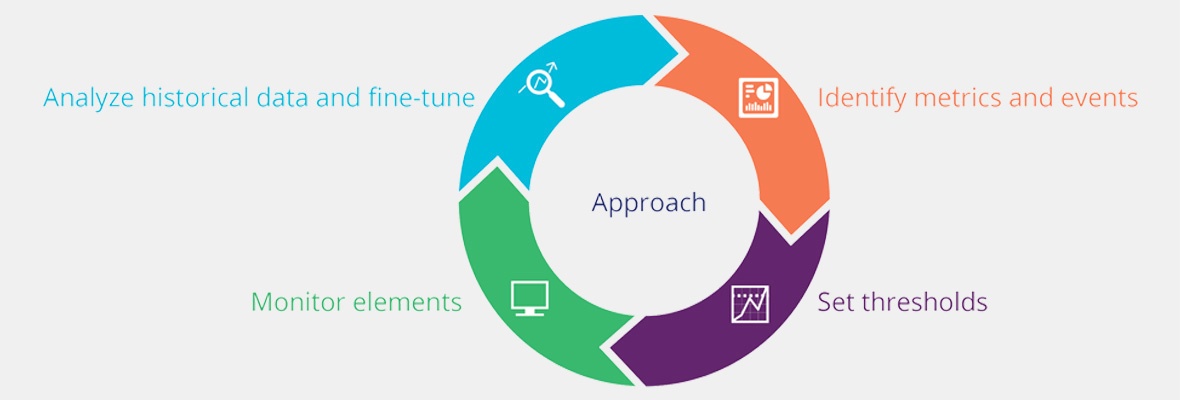
Figure 2 lays out the framework for predicting and detecting outages. Let’s look at the framework...

Step 1- Identify Metrics and Events
The first step is to identify metrics and events that are reliable indicators of failure. Metrics and events are data from IT elements that you monitor. Metrics carry information about the availability, performance, and capacity of your IT elements. The key to detecting outages is to select metrics and events values for monitoring.
Metrics are numerical data you can measure on the IT element directly. For example:
- Number of SQL query requests on your database application.
- CPU and memory utilization of your server.
Events are fragments of information emitted by your IT elements for indicating their status. For example:
- An event from your Microsoft Windows server about an application that has stopped functioning.
- A trap from your network device might indicate that a critical component has failed.
Events carry more information than metrics. Taken together, events and metrics deliver insights into the current and likely future state of your IT environment. The three types of outages call for selecting different types of metrics and events. Let’s look at these types...
Capacity metrics indicate that your IT element is running low on capacity for some resource (disk, memory, CPU, transaction processing capacity, etc). Here are some common capacity metrics:
- Low remaining disk space in your server or storage arrays reflects disk space conditions.
- High memory utilization or paging rates on your servers reflects out of memory conditions.
- High queue length values in the request queue of an application indicates that the application’s processing capacity has been used up.
Capacity metrics are available from the IT element. For example, Microsoft Windows includes memory utilization and paging rates. For custom applications, you may need to derive an appropriate capacity metric from other underlying metrics.
As you select or derive capacity metrics to monitor, look for metrics that answer one of these two fundamental capacity related questions (see Figure 3):
- For utilization metrics, does the metric show “how much” of the resource is remaining (e.g. disk space, memory)?
- For wait time metrics, does the metric show “how long” you wait to get access to the resource (e.g. disk I/O)?

Failure metrics and events show that a failure has either occurred or is about to occur. For example:
- 100% packet loss when you ping a network device.
- Disk failure events from a store array.
You can identify most types of failures by testing for known “vital signs” (see Figure 4). These are common types of vital signs:
- Response metrics: You can probe an element to measure its response to requests - e.g. response time to network or application requests.
- Progress checks: You can probe an element to check if specific processes are running and making forward progress - e.g. check if an SQL service is functioning.
- Self-reported events: Most elements emit diagnostic events about their health via logs or events.

Change metrics get triggered by human error. These errors cause changes to the environment that, in turn, result in component failures or capacity issues. Such changes encompass updates to applications or infrastructure configuration.
In modern IT environments, a majority of outages are due to changes. A typical IT environment undergoes many changes a day. It might be tens of changes in a traditional environment to thousands of changes in a “DevOps” style environment. It is usually not practical to assess the impact of every change before deploying the change. So, the question of predicting change related outages is moot, in practice. You can, however, retrospectively attribute outages to changes that likely caused the outage. To do this, consider the following:
- >Metrics to measure change volume. You can track the volume of changes rolled out like the number of application updates on a server.
- Correlate failures to changes: When diagnosing an outage, look at change volumes preceding the time of the outage. Outages due to a change manifest soon after the change. Figure 5 shows a conceptual example of this approach.

Step 2 - Set Thresholds
Once you’ve identified metrics, detection and prediction is a matter of selecting the right threshold values for your metrics. A threshold value can show that a failure is underway (detection) or stipulate an emergent issue (prediction). Figure 3 shows conceptual examples of detection and prediction thresholds.
Detection. Threshold values for detection are usually straightforward to identify. The normal range of key metrics are usually known and key failure events are also known. For example:
- Sustained CPU utilization over 95% indicates a capacity issue on a server.
- Disk failures have specific events associated with them.
Prediction. Threshold values for prediction involve a tradeoff. There's a tradeoff between getting a false prediction versus not getting enough early warning on an issue. For disk space, you can set threshold for free space anywhere between 70% (aggressive) to 90% (conservative). You can use historical data to find the optimal tradeoff point.
Step 3 - Monitor Your Elements
For monitoring, classify your IT elements into two types, single points of failure and redundant points of failure. You need to approach monitoring these two types of elements a bit differently.
Single points of failure. These elements are the “weakest link” in your IT chain. Single points of failure have no redundant counterparts that can take over their function, if they are unavailable. For example, Figure 6 shows a typical application deployment with load balancers, application servers, and a database server. The load balancer and database servers are the single points of failure. A single point failure will lead to an outage. So, remember to track each single point of failure.
Redundant points of failure. These elements are “clustered” together, so that if any of them fail, another peer within the cluster can take over. For example, in Figure 6, the application servers are redundant points of failure. As long as one server is running, the application will continue to function.
A failure at a redundant point will not cause an outage immediately. You should track the state of individual elements and the aggregate state of the cluster. Apply detection and prediction thresholds both to individual elements and to the cluster. Figure 6 provides an example. You need to track each application server as well as the number of available elements in the cluster. If your application works with one running application server, your detection threshold for the cluster would be 0 and prediction threshold could be 1.

Step 4 - Analyze Historical Data and Fine-Tune
Every failure instance is a valuable data point from which you learn and fine tune metrics, events, and thresholds. Analyze historical data from failures at each element to identify their root cause. If the failure wasn't detected or predicted by your monitoring system, analyze the failures. Your goal is to identify specific metrics, events, and thresholds that will be better failure indicators. Incorporate these results into your continuous improvement cycle.