Vistara is pleased to announce the availability of Vistara 3.4, which includes the following new enhancements:
Continuous Element Discovery
IT operations management is increasingly dynamic. In the past, only IT administrators could provision new infrastructure elements. Modern IT organizations empower their line of business users to provision virtual infrastructure elements on-premises, in the private cloud, and on the public cloud to achieve a responsive self-service model for IT operations management. As a result, IT organizations today are increasingly required to productively manage infrastructure elements that are physical and virtual, on-premise and cloud-based, and provisioned by IT administrators or line of business users themselves.
If a line of business user can provision a new infrastructure element on-premises or in the private or public cloud, how can IT make sure that the appropriate management templates are applied to the new element? Vistara now continuously discovers new infrastructure elements on a schedule defined by IT and presents newly-discovered elements to IT administrators so they can choose how the newly-discovered elements should be managed.
Automatic Policy-Based Element Management
To maximize productivity, IT organizations must automate the management of new or existing infrastructure elements that have been automatically discovered. Vistara empowers IT administrators to define rules that take the following actions on newly-discovered or existing infrastructure elements:
- Elements can be assigned to a logical group so they are associated with a particular business unit, service, or application.
- Elements can be assigned to a physical or virtual site so IT knows which data center, office, private cloud, or public cloud they are part of and can manage them together with the other elements at that same site.
- Standard monitoring templates can be applied to devices so that IT will monitor all of the attributes of that device specified by internal policies.
A rule can match or skip an element based on its element type, element model, custom attributes, or operating system. Values can be compared using the operators like, not like, contains, not contains, starts with, ends with, doesn't start with, or doesn't end with.
Examples of Continuous Element Discovery and Automatic Management in Action
Here are a few examples of rules that an IT administrator can define to automatically manage newly-discovered elements or existing elements that were unmanaged to date:
- If a new instance is discovered in Amazon Web Services East Coast Region, add it to the logical AWS-East-Coast site.
- If a new instance is discovered running Windows Server 2012, apply the Windows Server 2012 monitoring template so that we monitor key performance indicators for Windows.
- If a new Dell server is discovered whose name starts with "web," add it to the web server group so IT administrators can browse the IT infrastructure hierarchy and see it present in the list with all of the other web servers.
The ability to continuously discover and automatically manage elements enables the efficient management of infrastructure elements in cloud and virtualized environments, where elements are constantly added and removed dynamically.
Configurable Dashboards
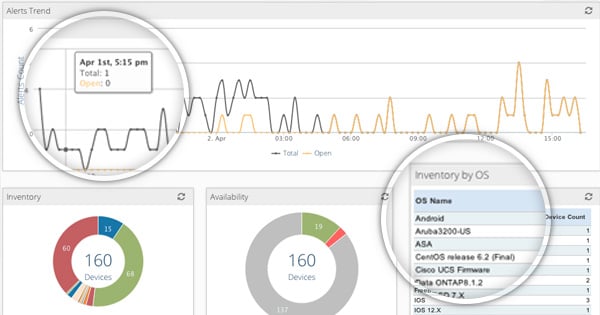
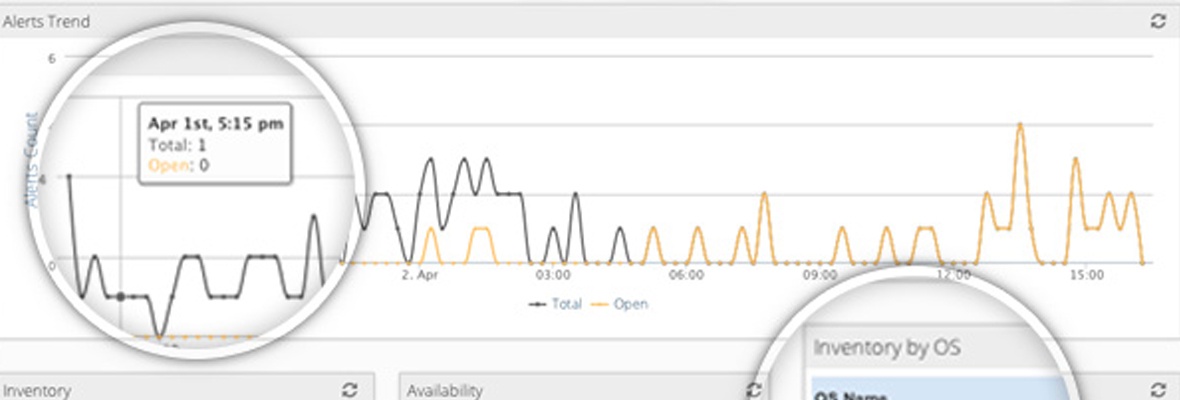
Individual IT administrators need to be able to define a custom dashboard to give them a heads-up display focused on their own responsibilities. Nearly every customer wants to provide a heads-up display to their IT administrators so their attention is focused on the organization's most important metrics as soon as they log in. Vistara now enables each user to customize their dashboard to hide or show widgets of their choice in an order of their choosing. For example, a Level 1 administrator can focus the dashboard on the status of devices, alerts, and tickets that he or she is responsible for, while an IT manager can focus on overall operations health.
Enhanced Management for WAN Links and Network Interfaces
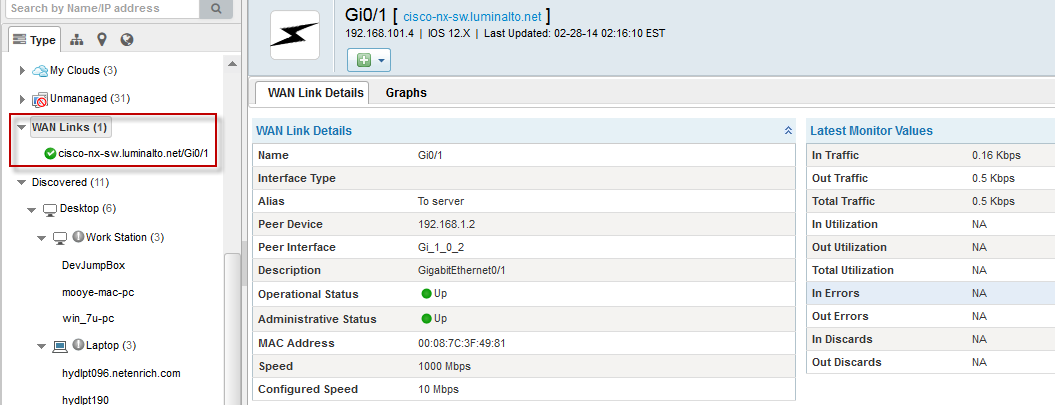
IT administrators need a global view of their WAN links so they can see at a glance how their IT infrastructure is connected. Vistara now makes it easy to identify the WAN links on network devices and to specify additional properties such as their connectivity, purchased speed, committed information rate, and excess information rate. A new WAN dashboard enables administrators to view all the WAN links in their environment, and Vistara's Network Statistics report has been enhanced to provide standard reports about all the WAN links.
Alert Management Enhancements for Business Hours and Alert Views
Like it or not, one of the core activities of any network operations center is alert management. Vistara has added a couple of new features to its already robust support for alert management: a business hours indicator, and alert views per user.
Alerts that occur during your customer's business hours are often more urgent to address than those that occur during nights or weekends. Vistara's alert browser now features a business hours indicator that indicated an alert that has been triggered during your customer's business hours. IT administrators can define which hours of the day are considered business hours.
Enterprises can specify business hours schedules on a per-business unit basis. Managed service providers can create these definitions on a per-customer basis so that customers in different time zones or with different schedules are handled appropriately.
Vistara's Alert Browser already featured robust support for filtering alerts by network operations center, business unit, customer, physical or logical site, device group, device type, host name, alert priority, alert type, date, and more. IT administrators can now save up to five combinations of alert filtering criteria as "alert views" for future use. For example, they can create filter settings that bring up alerts for:
- Alerts on Network Devices
- Alerts on Windows Servers
- Alerts in San Jose
Enhanced Support for IBM Storwize and HP EVA Storage Arrays
Vistara now provides improved support for IBM Storwize and HP EVA storage arrays. This includes identification of all components of the system such as the storage processors, volumes, LUNs, pools and disks, a comprehensive dashboard, and a default report about each type of array.
Configurable Report Schedules for Enterprise Business Units or MSP Customers
Vistara already has a robust set of built-in reports and the ability to schedule reports for automatic generation and emailing to specified users. Vistara 3.4 enables enterprises to conveniently specify that standard reports should be run for all their business units on a specified schedule. For example, shared services IT can specify that on the first day of the month, every business unit should receive its Customer Executive Report with key performance indicators for the previous month. Similarly, managed service providers can specify that every one of their customers should receive their own Customer Executive Report on the third day of the month.
Improving IT Administrator Productivity Through Automation
The future of IT operations management lies in automating routine activities and increasing administrator productivity so IT administrators can focus their precious time and energy on higher value-added activities like envisioning and delivering new services to their stakeholders. Vistara 3.4 takes IT operations management in this direction by automating element discovery and management, empowering administrators with dashboards customized to their individual needs, and providing saved views of commonly-used alert filter combinations.


