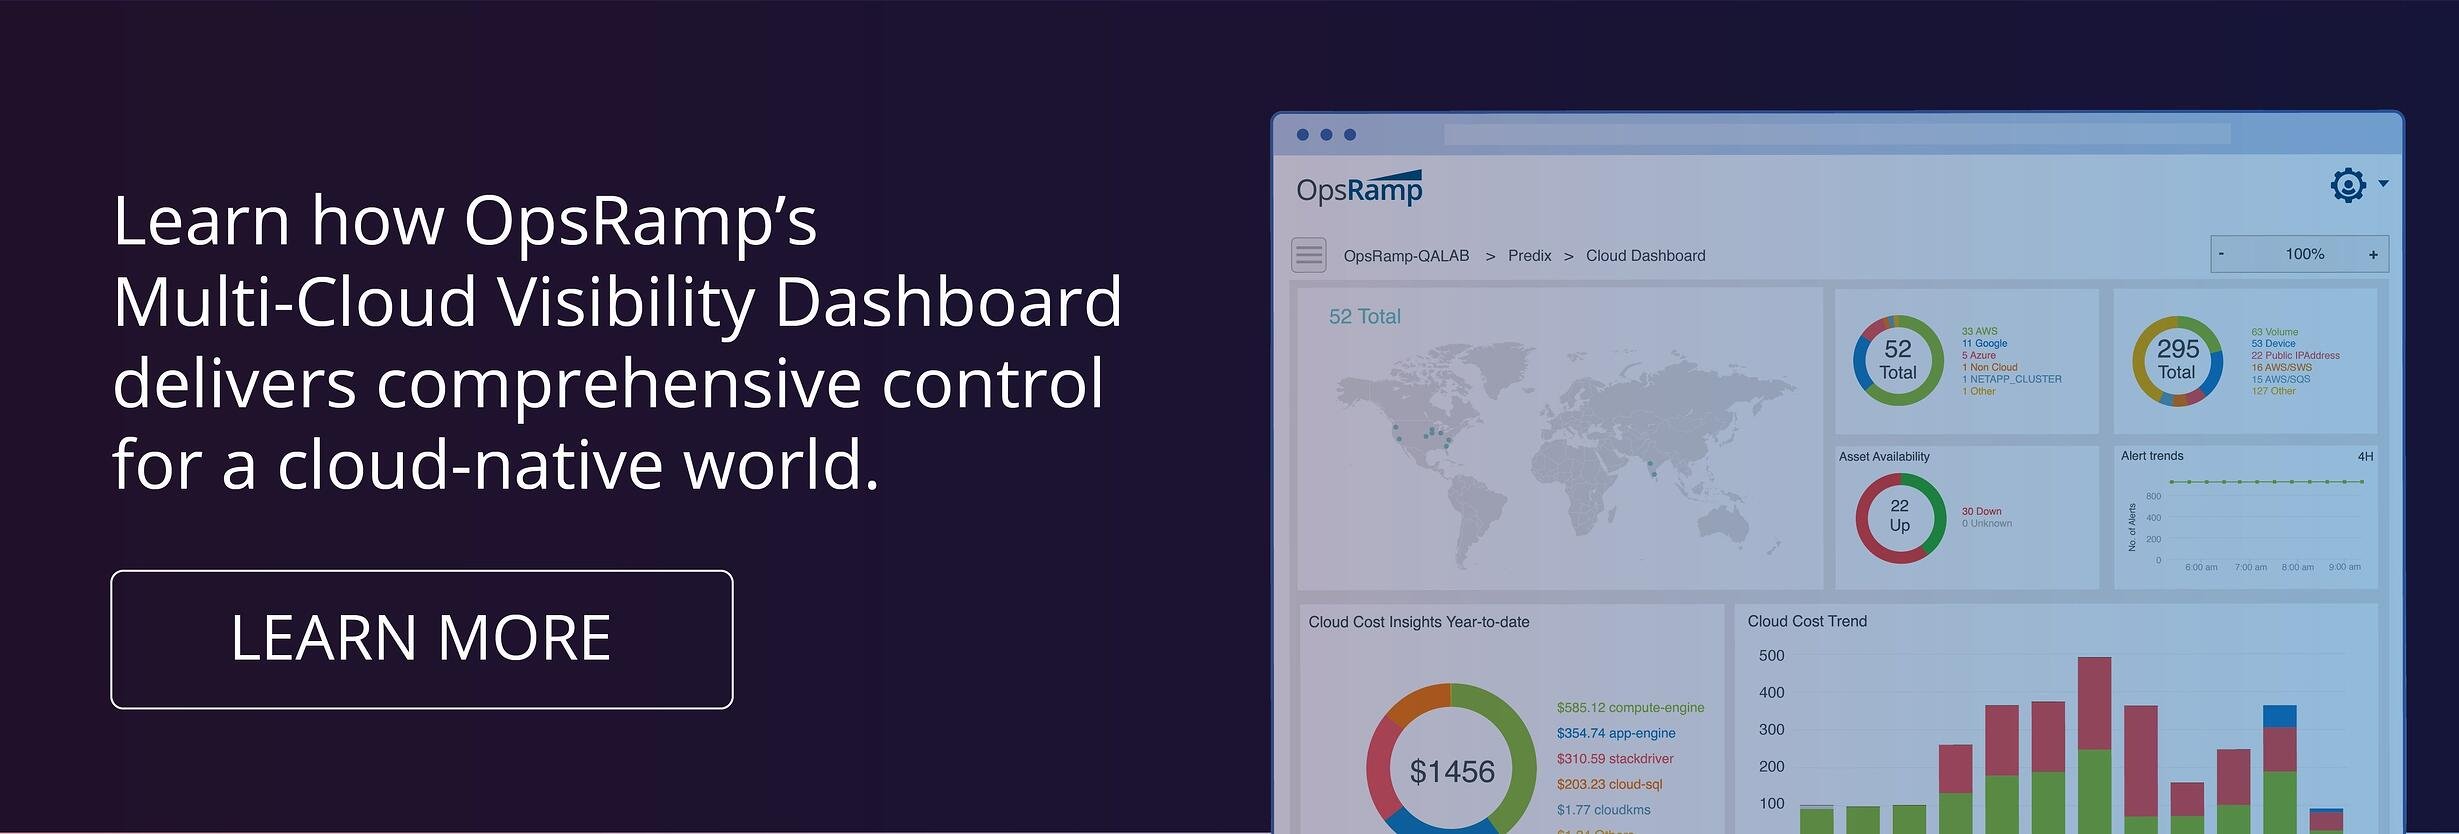


You Can’t Manage Modern Cloud Environments If You Can’t See Them
With more enterprises embracing ‘cloud-first’ strategies, there is a clear need for operational visibility, governance, and control across hybrid IT environments. IDC believes that as "cloud adoption becomes less of a question and more of an assumption, the biggest focus areas will be multi-cloud management.”
With the 5.0 Release, OpsRamp has delivered a solid set of capabilities for multi-cloud operations. OpsRamp presents your multi-cloud assets, drives service availability and event management, and showcases cloud spending trends across AWS, Azure, and Google. Let’s take a closer look at how the multi-cloud visibility dashboard works.
Gain Clarity and Control With Three New Cloud Widgets
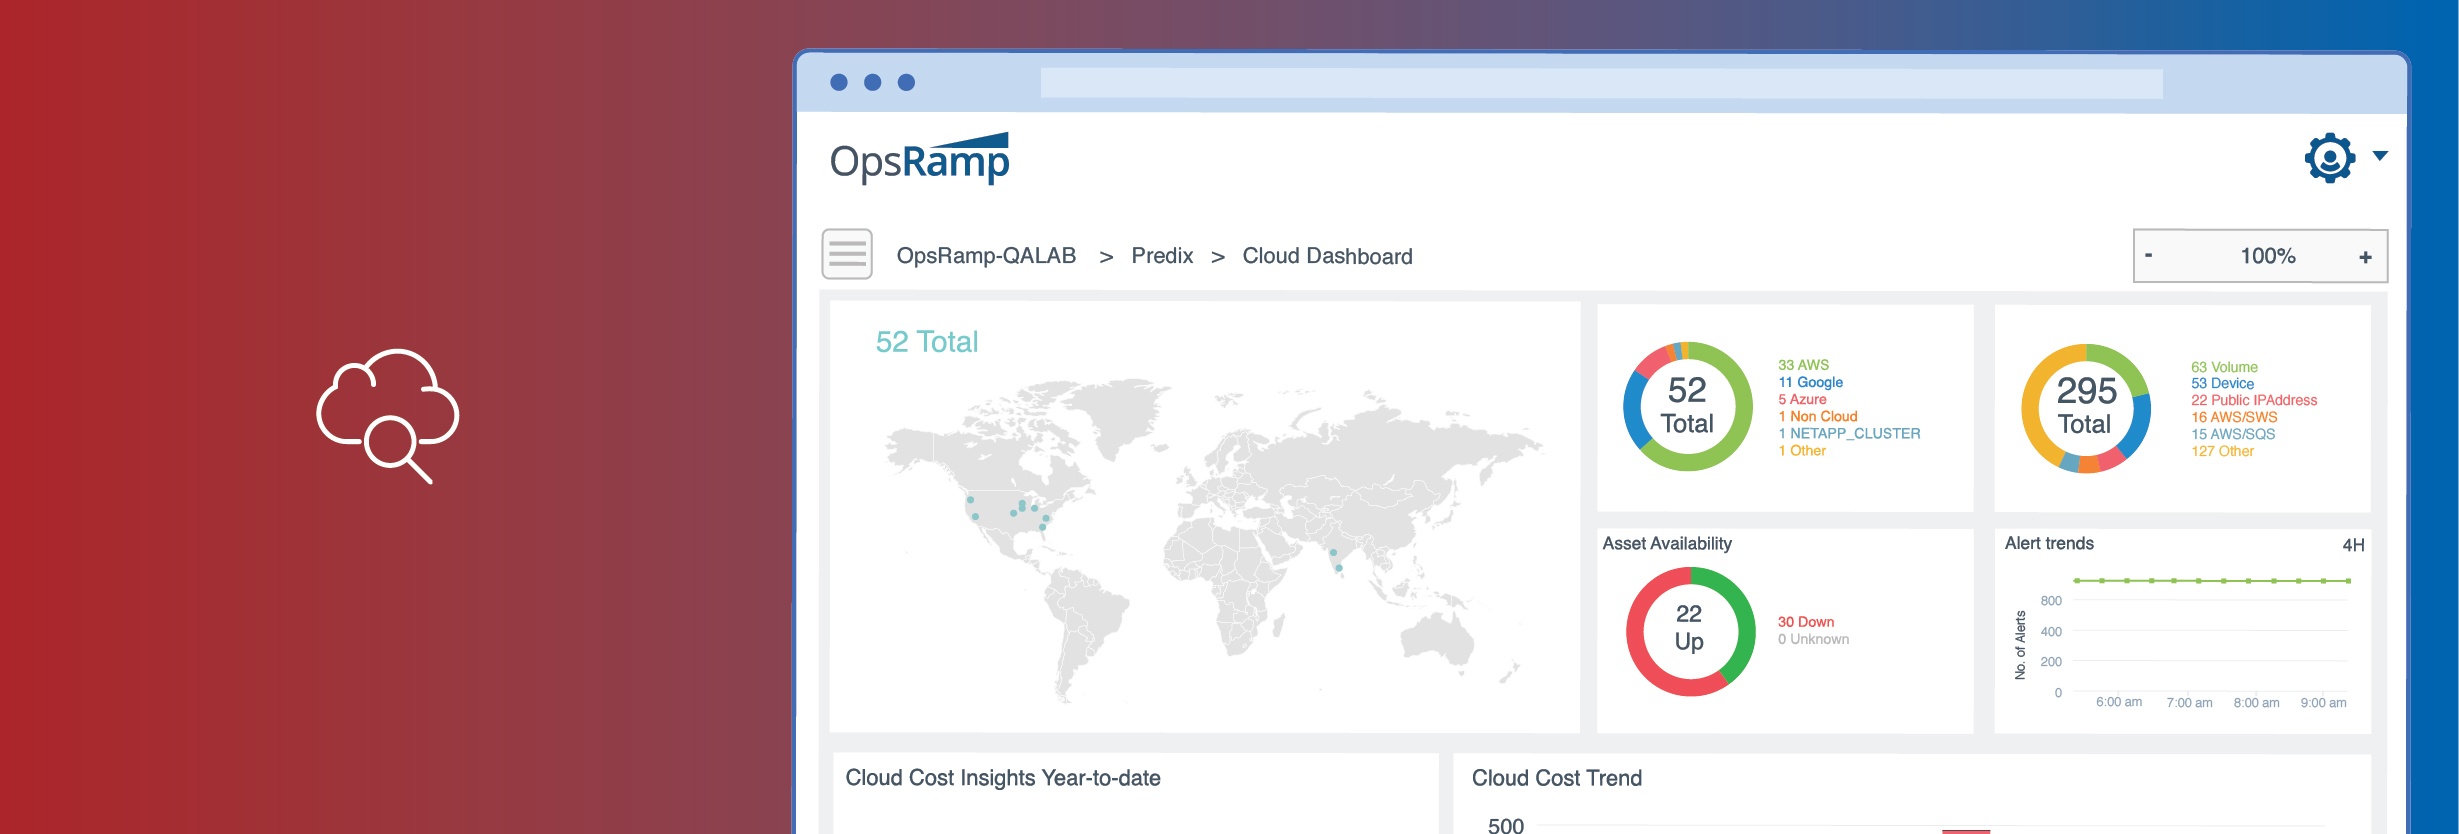
Once you configure your public cloud services in OpsRamp, the new multi-cloud visibility dashboard becomes your default dashboard. As a multitenant operations platform, OpsRamp’s cloud dashboard delivers insights for your individual business units and across your enterprise once you’ve onboarded your cloud resources.
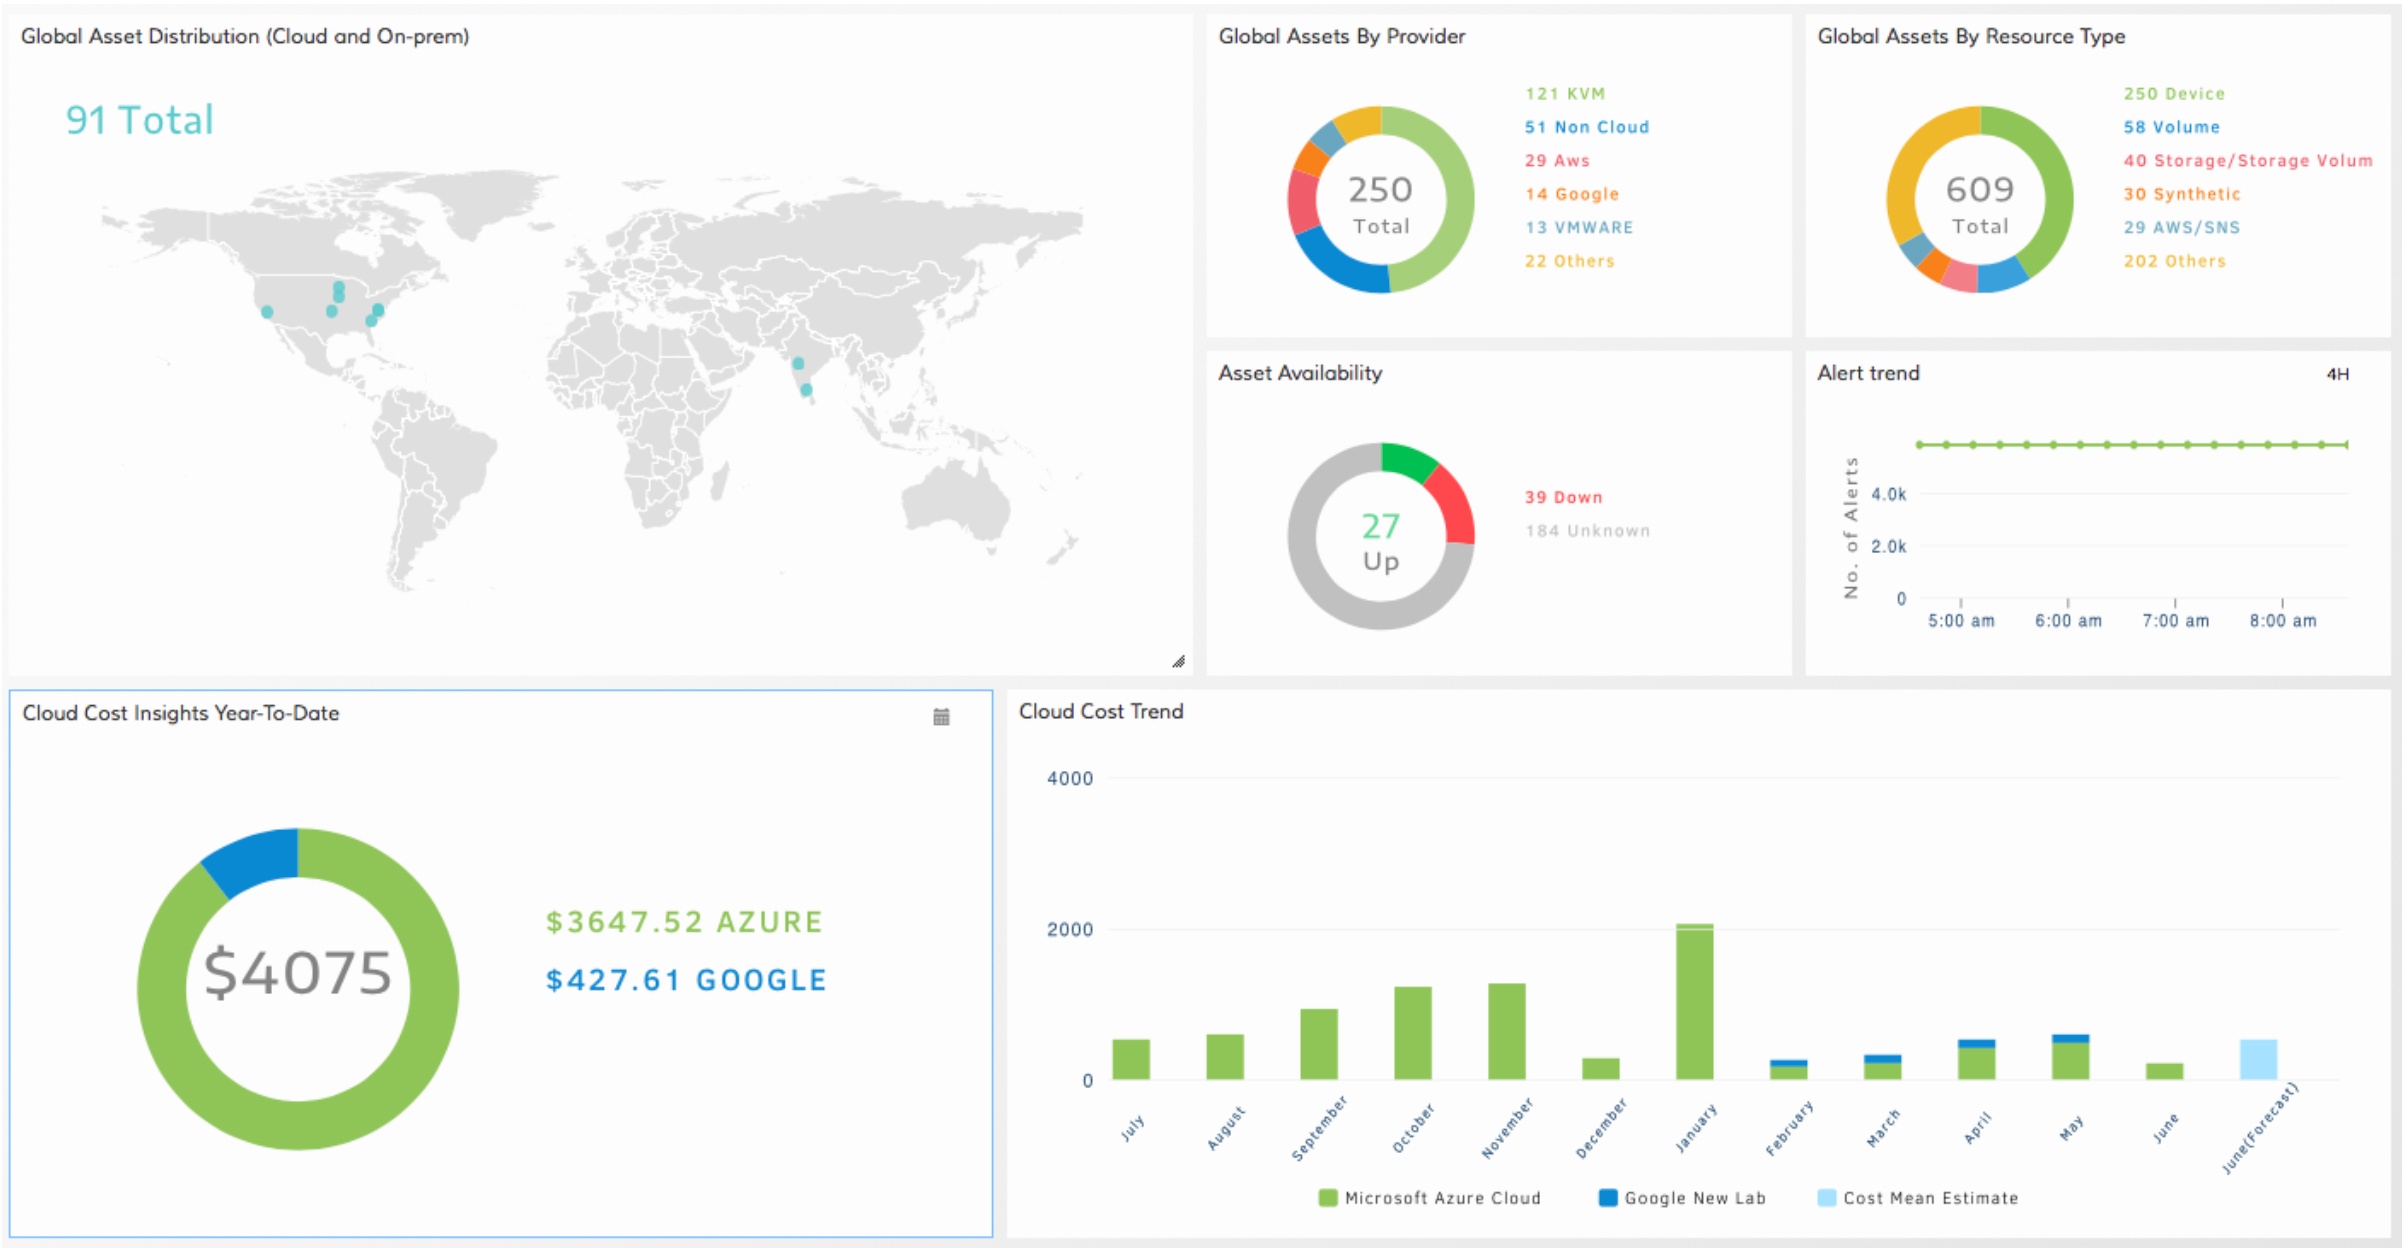
Figure 1 - OpsRamp’s Multi-Cloud Visibility Dashboard At A Glance.
OpsRamp now supports discovery and monitoring for 46 Microsoft Azure, 28 AWS, and 15 Google Cloud services for scalable multi-cloud operations. You’ll have access to performance metrics, platform alerts, and cloud spending trends, in a single place. Better manage cloud services and budgets for business units or enterprise-wide applications with our three new predefined widgets:
- The Global Assets widget shows the geographical distribution of hybrid IT assets across datacenter and cloud environments.
- The Cloud Cost Insights widget displays public cloud spend to date, with a breakdown by cloud account, custom attributes, and other criteria.
- The Cloud Cost Trends widget presents public cloud cost trends over time, enabling easy access to cost trends by resource type, custom attributes, and other criteria.
Analyze And Optimize Your Multi-Cloud Workloads
The multi-cloud visibility dashboard lets you group hybrid IT assets by resource type, device type, or provider type. You can view the asset distribution by cloud region and cloud account for your cloud services and group assets by specific tags such as a business unit or an application. The Geographic map view is available through the “Site” option, where cloud regions are automatically discovered and displayed on the map, while you'll need to enter datacenter locations under the “Infrastructure - Site” option.
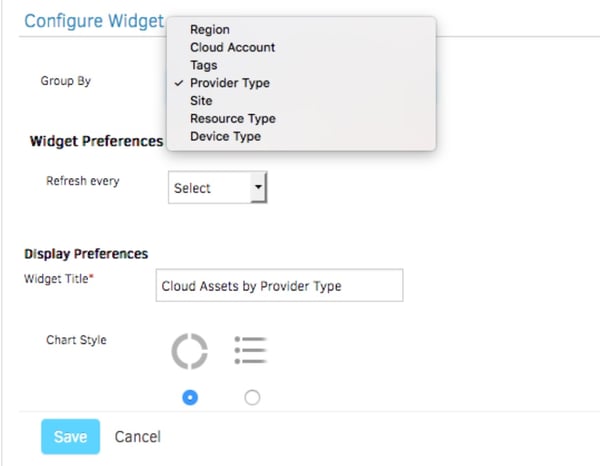
Figure 2 - Organize and View All Your Hybrid IT Assets In One Place.
The Cloud Cost Insights widget shows the month-to-date spending for all your cloud services. You can configure the widget for a given period (Last Month, Year-To-Date, Last Year etc.), as well as for a specific provider type, cloud account/project, or tag value.
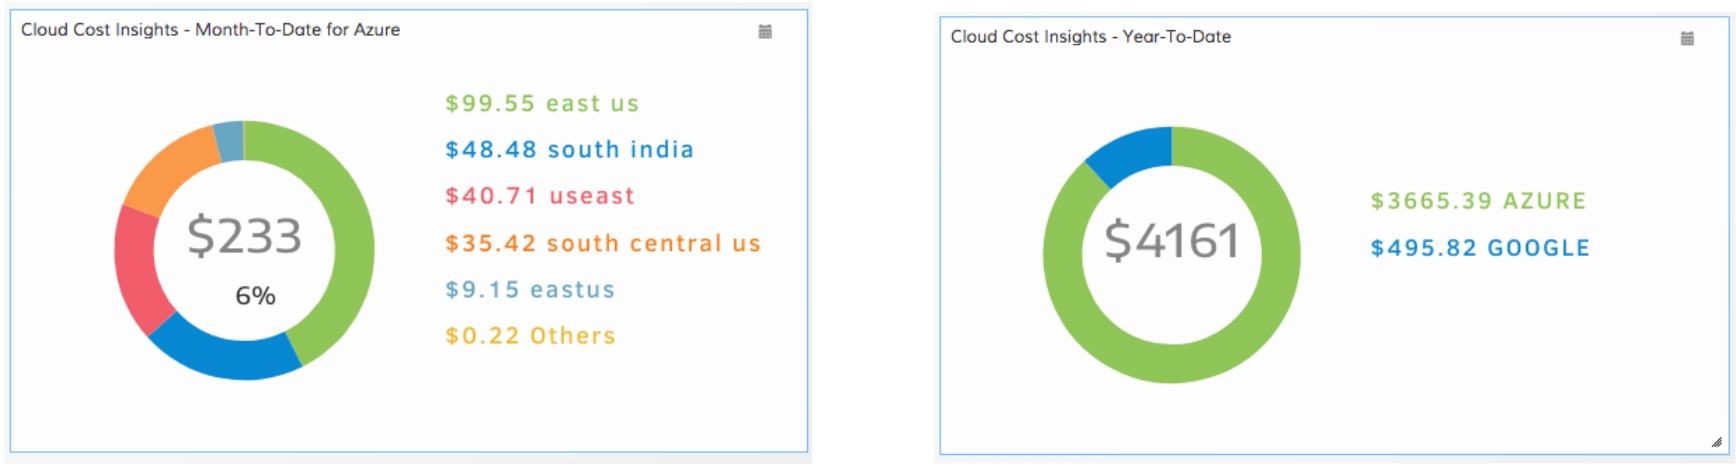
Figure 3 - Analyze Your Cloud Spending With The Cloud Cost Insights Widget.
In OpsRamp, tags are similar to custom attributes and you can use our device management policies for global tagging. OpsRamp can also fetch resource tags from cloud providers and populate them as custom attributes, with key and value pairs. Once you implement a global tagging policy, use tags as a filter in the Cloud Cost Insights and Cloud Cost Trends widgets for details of cloud spend by business unit, cloud provider, or IT services. Figure 4 shows how you can tag your business units and display cost trends for your cloud services.
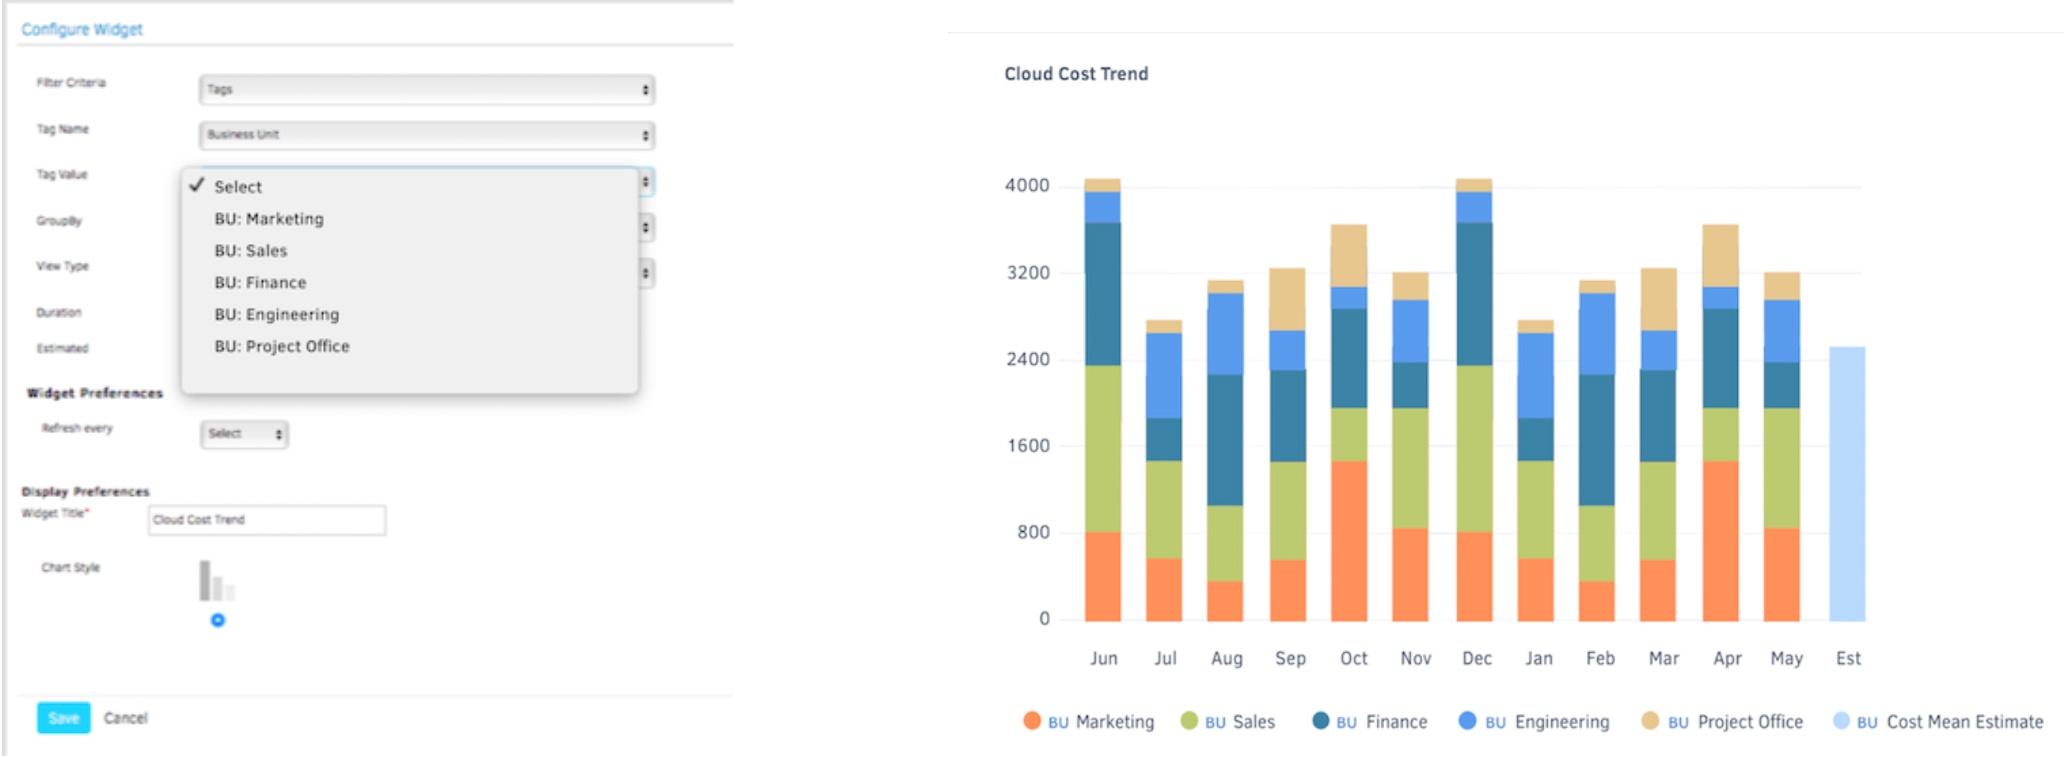
Figure 4 - Set Up Your Business Units Tags For Cloud Spending Insights.
The Cloud Cost Trends widget lets you analyze historic spending data and patterns, through different service categories, instance types, cloud regions, or purchase types (on-demand vs reserved instances). Configure the widget to show cost data across different providers, multiple accounts in a single provider, or a single tag value.
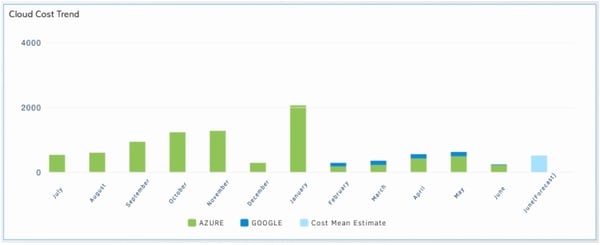
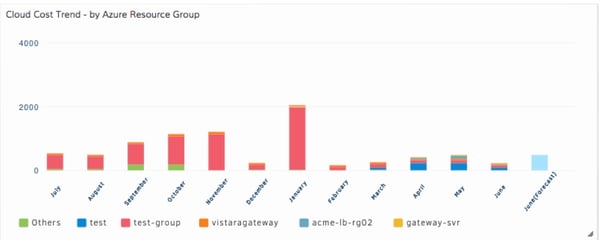
Figure 5 - Access Consolidated Spending Trends For All Your Multi-Cloud Workloads.
IT Operations teams can define budget policies for a cloud account or any tag value (like a business unit etc.) to receive alerts when the actual spending exceeds defined thresholds. Once you configure escalation policies, you can forward budget alert notifications to relevant stakeholders in your enterprise.
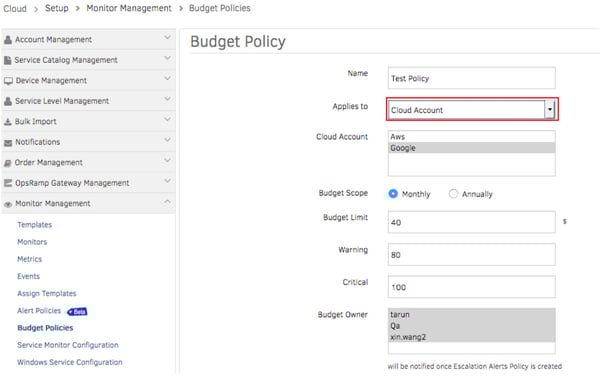
Figure 6 - Create Budget Policies For Timely Notifications On Cloud Spending.
When you select the Manage Device and Collect Cost Analytics options in the Discovery profile during cloud integration, you’ll be able to access Cloud Cost Insights and Cloud Cost Trends data. For more details on how to configure the cloud widgets, please refer to our product documentation.
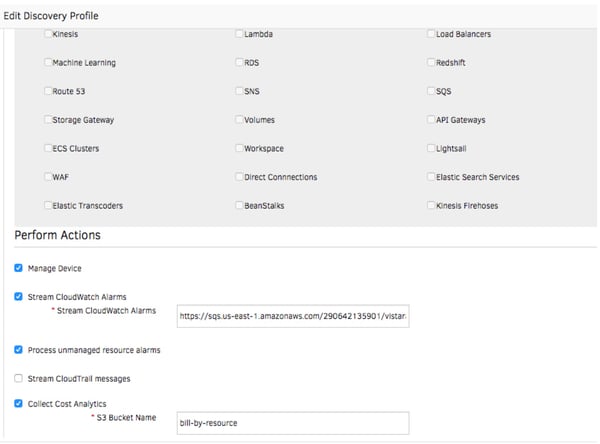
Figure 7 - Use OpsRamp Discovery Profiles For Multi-Cloud Management.
This is just a taste of our multi-cloud operations features in OpsRamp 5.0. Stay tuned for more deep dives into the future of what we call IT Operations as a Service. We’ll showcase how our new capabilities like the AIOps Inference Engine and enhanced Service Maps drive effective and efficient IT Operations.
Next Steps:
- Download our datasheet on hybrid cloud management.
- If you’re looking to embrace multi-cloud management with confidence, talk to an OpsRamp solution consultant today.