

Every IT resource in your environment participates in an IT service that serves internal and external users in your organization. An IT service may be an application (e.g. an order management application) or an infrastructure service (e.g. Wi-Fi in an office building).
Consider an application running in your datacenter. Here are some possible scenarios that can occur:
- Users of that application experience disruption if the application stops functioning.
- The application will go down if the servers on which it runs shut down.
- The servers will be effectively unavailable if the network switches that connect them don't work as expected.
The user experience for an IT service depends on different IT resources, each of which can have an impact at a particular infrastructure or service layer. In day-to-day operations, it is important to have a clear line of sight between IT resources and their impact on the users.
You must be able to answer the following questions to prioritize and plan your operational tasks effectively:
- Are all the workloads supporting my IT service up and running?
- Which users get affected if I reboot these servers for maintenance?
- Did users of this service experience any downtime in the last month?
IT service visibility becomes even more important when you have distributed workloads across datacenter and cloud environments. So, how do you manage the availability and performance of your mission-critical IT services?
Enter Service Maps
OpsRamp’s Service Maps help organize your IT resources into a hierarchical structure for faster user impact analysis. Figure 1 shows a service map for an IT service that is a web application, with application servers, database servers, and a load balancer. The node titled “Users of My Application” represents users of the service.
If your application servers, database servers or load balancer becomes unavailable, your IT service will stop working. Service Maps let you set rules for how a node and its different components interlink. You can use service maps to automatically track service impacts based on the rules you've established. In Figure 1, “Users of My Application” are experiencing degradation, as one or more application servers are down.
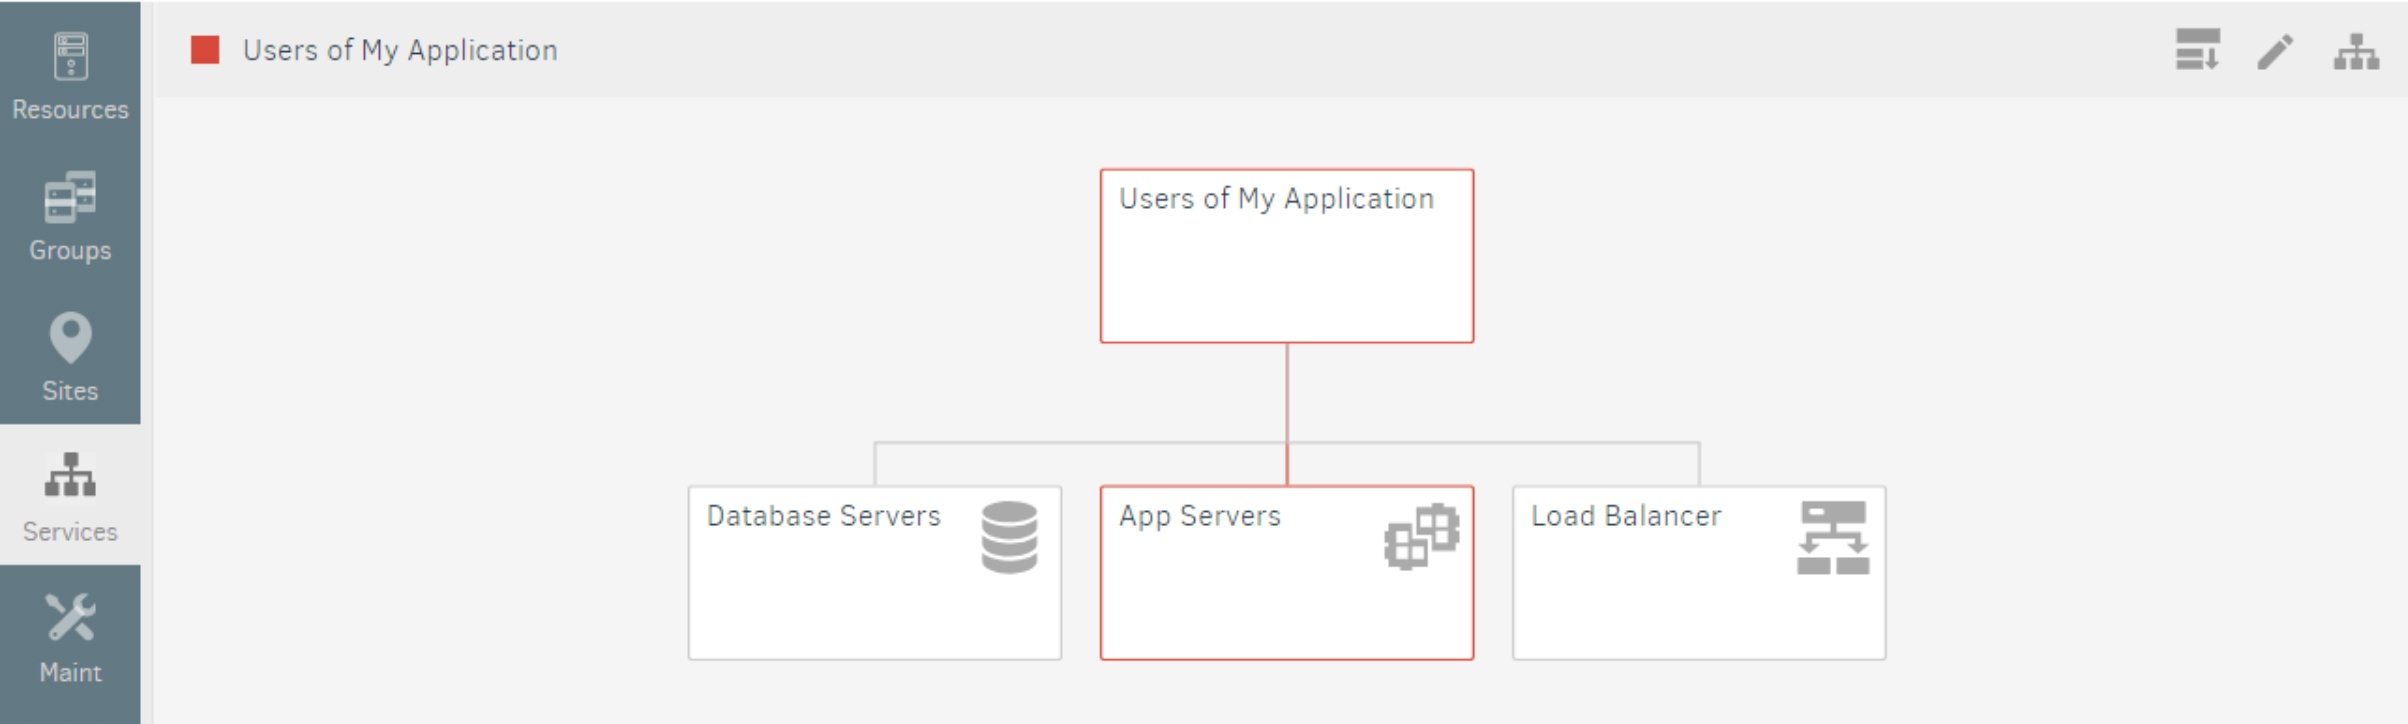
Figure 1 - Track IT Service Impact On Users With Clear Line of Sight
Service Map Design Patterns
Base the design of your service maps on the type of IT services in your environment and the granularity at which you want to track user impact. Let’s look at three common design patterns for service maps.
Design Pattern #1: Users Of A Specific IT Service
In this design pattern, you want to track user impact for a specific IT service. The IT service is a web application with three components as shown in Figure 2:
- A load balancer that serves the entry point to the service (https://myapp.mycompany.com)
- Application servers
- Database servers
Here are some questions of interest for this IT service:
- Is the service available to users?
- If the service goes down, which component is causing the issue?
- What percentage of the time was the service available to users in the last month?
- How much of the service’s downtime depends on each of its components?
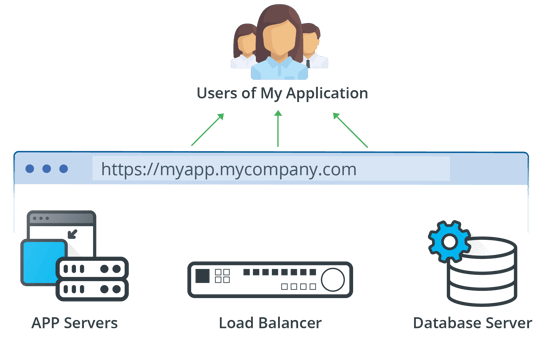
Figure 2 - A Simple IT Service That Serves A Specific Set of Users
To answer these questions, create a service map as shown in Figure 1. The node labeled “Users of My Application” represents all users of the service, and the remaining nodes each represent different application components. “Users of My Application” will experience degradation if any of the three components become unavailable.
Design Pattern #2: Users Of Two Related IT Services
In this design pattern, consider two IT services used by the same set of users at the same time, as shown in Figure 3. Each service is a web application, just like the application in the first design pattern.
Here are some questions of interest for an interrelated IT service:
- Are both of the services available to users?
- What percentage of the time were both services available to users in the last month?
- Which service most impacted users in the last month?
To answer these questions, organize your users into the following hierarchy:
- All users (users of applications A or B, or both)
- Users of application A
- Users of application B
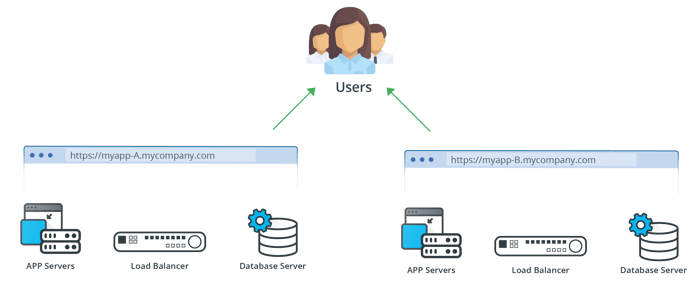
Figure 3 - Two Different IT Services That Support The Same Set of Users
Your service map reflects this hierarchical grouping of users as seen in Figure 4. Define “All Users” who will see an impact if “Users of Application A” or “Users of Application B” get affected. This design pattern lets you automatically display information about user impact to either service and consider additional details about a specific service, only when necessary. Such automatic visualization of impact information is particularly useful when you manage a large number of interrelated services.
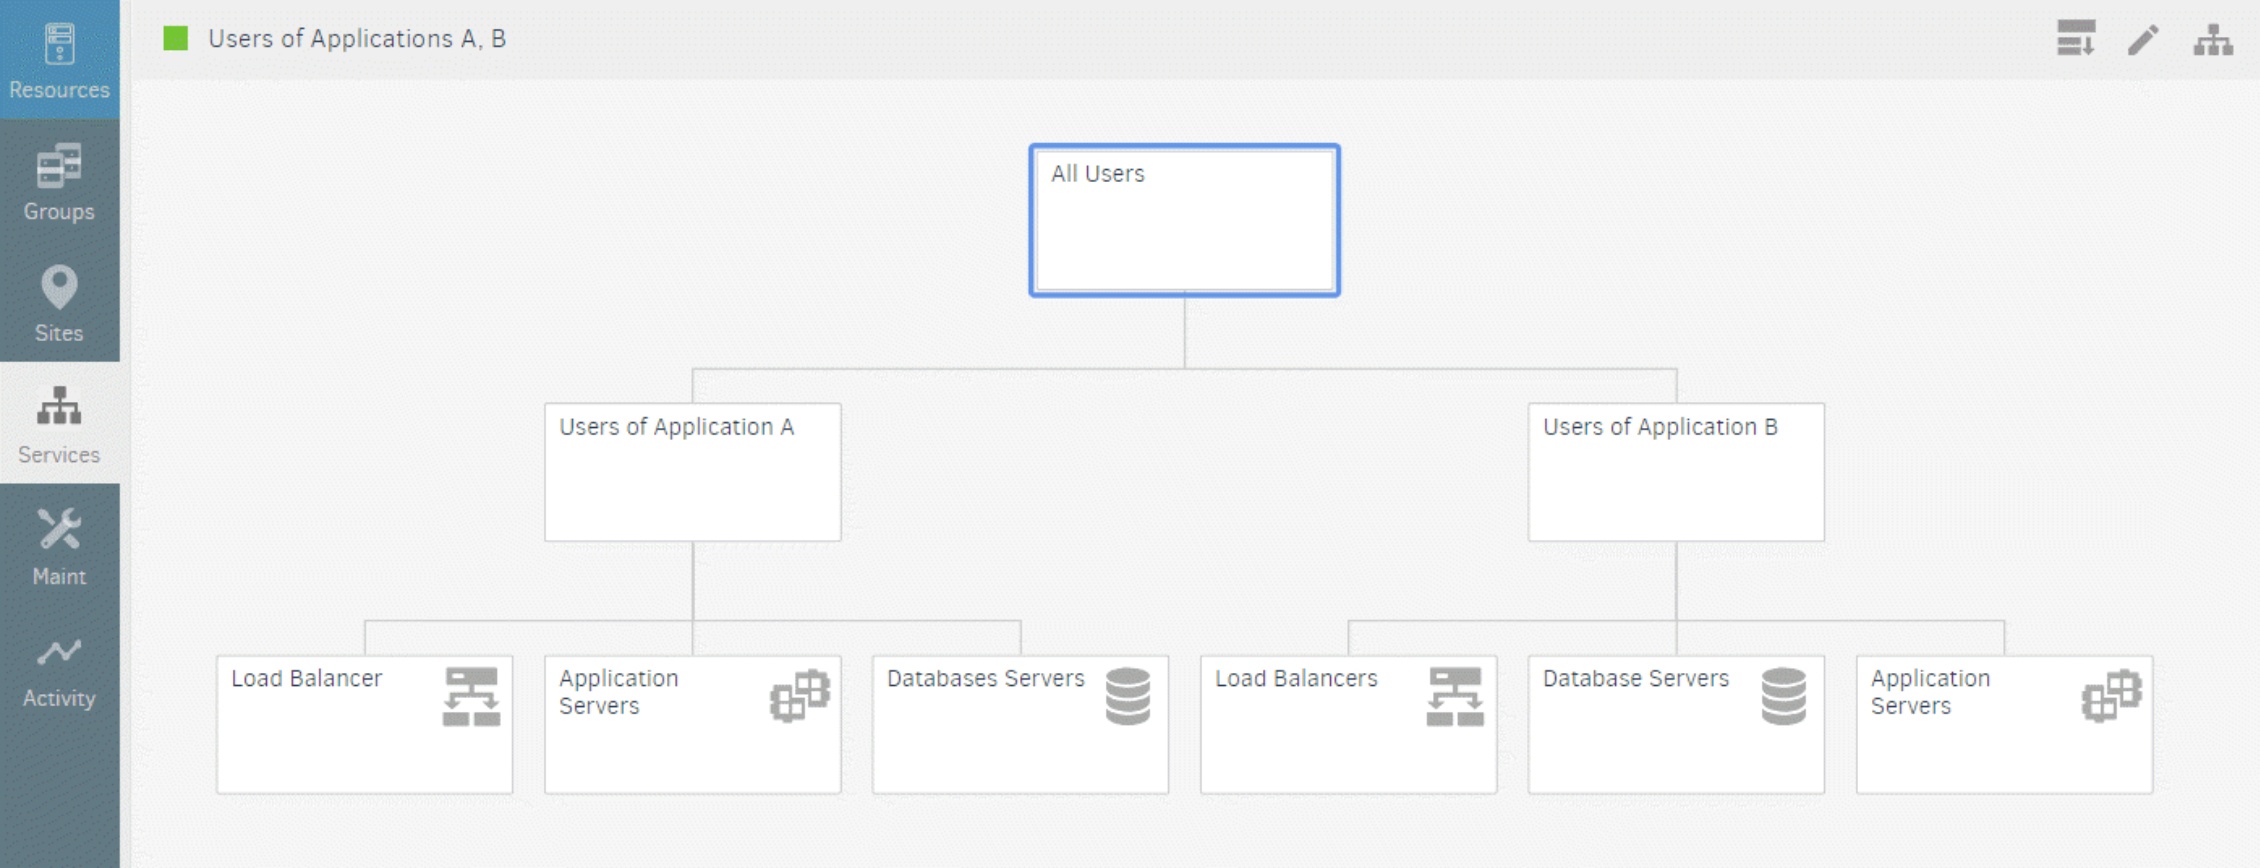
Figure 4 - Visualize User Impact and Performance For Interrelated IT Services
Design Pattern #3: Users Of An IT Service Across Specific Locations
Consider an IT service that delivers Wi-Fi connectivity to an office building. The Wi-Fi connectivity service has Wi-Fi access points across three floors of a building, as shown in Figure 5.
Here are some questions of interest for this IT service:
- Is the Wi-Fi service available to users on each floor?
- What percent of the time was the Wi-Fi service available to users in each floor, in the last month?
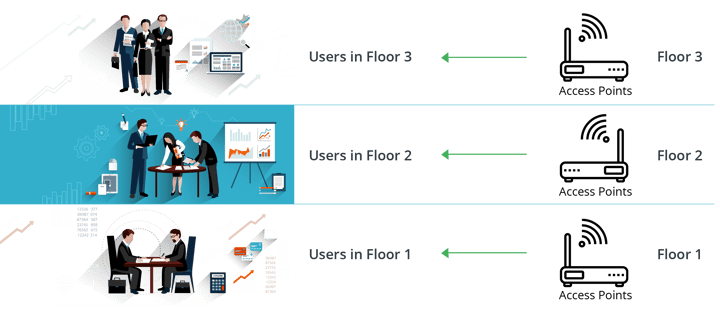
Figure 5 - An IT Service That Supports Users Across Several Locations
To answer these questions, define nodes that represent Wi-Fi users in each floor. A single node will represent all the Wi-Fi users across the three floors in the building, as shown in Figure 6. Each of these services is dependent on access points on that floor. If the Wi-Fi service is available, a minimum number of access points are up and running provided there’s adequate coverage for the floor.
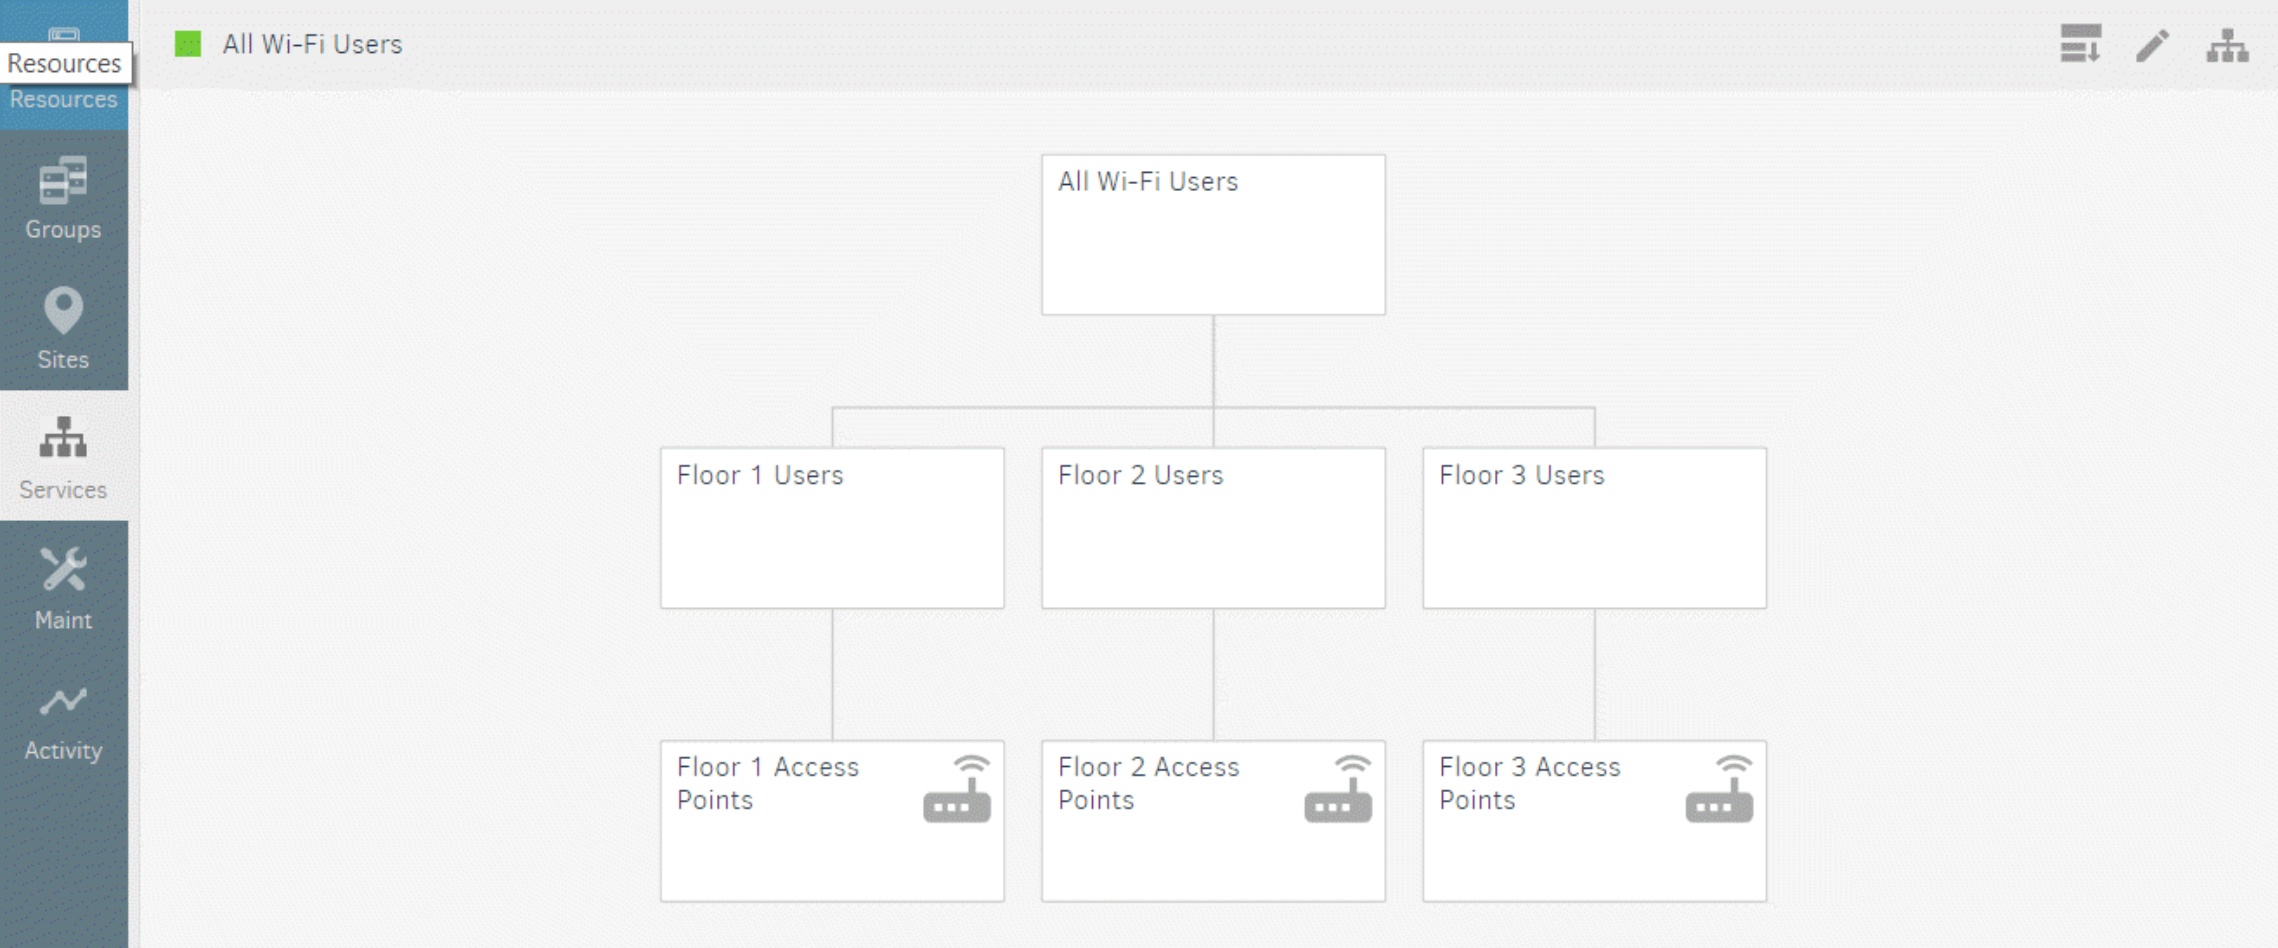 Figure 6 - Visualize User Impact Across Locations For A Single Service
Dimensions of Impact
While we’ve discussed user impact in the context of service availability, the impact also applies to different measures of IT service health, such as:
- Service Performance: Are the users of a service receiving good response times?
- Service Capacity: Is there enough capacity to support projected demand for the service?
- Service Compliance: Are resources participating in the service complying with organizational practices?
In the context of service maps, we’ve talked about the impact that IT resources have on users. There is also another important dimension of impact - the impact that IT resources have on each other. If a server running containers supporting a microservice fails, all the containers running on it might stop functioning. Service Maps help model these dimensions of impact, which we’ll discuss more in future blogs.
Next Steps:
- Download our datasheet on service maps.
- If you’re looking to deliver service-oriented IT Operations management, talk to an OpsRamp solution consultant today.