

IT Ops and DevOps people live by metrics – but not all metrics are the same. These days, setting and achieving meaningful service level indicators (SLIs), which translate to service level objectives (SLOs) is a desirable target for many IT pros. Meaningful SLOs have a tight connection with real-world user experiences, versus arbitrary metrics that may distract teams from the root cause of an issue.
Some common examples of SLOs are:
- 99.99% of web page load times will complete in less than 250ms.
- 99% of HTTP(s) requests will be successful.
- A web page (application) will be 99.99% available
From these metrics, you can calculate the error budget, another important SLO. If your SLO is that 99.99% of web page load times will complete in less than 250ms, then you can afford .1% of load times out of that range, i.e. greater than 250ms. The net result of setting SLOs is an agreement (formal, or informal) with the end user or customer. This is often referred to as an SLA, or service level agreement. The SLA generally has consequences if not met, such as credited usage, discounted months, or potentially a termination of contract.
As Google defines it: “An SLO sets a target level of reliability for the service’s customers. Above this threshold, almost all users should be happy with your service (assuming they are otherwise happy with the utility of the service). Below this threshold, users are likely to start complaining or to stop using the service.” We all want the happy user metric, but it can be elusive.
A Better SLO
Unfortunately, it can be difficult to achieve these SLOs. Since SLOs are derived from the metrics that comprise them, you need infrastructure monitoring software that’s capable of ingesting the right metrics. Many organizations rely on ping (ICMP), which has been the de facto standard for defining a service level indicator and which usually translates into a SLO around availability. Unfortunately, the ping is a somewhat limited metric: it indicates that a resource is online (“pingable”) but it doesn’t necessarily measure business impact, or if the service is actually performing what is intended to do. Yes availability is always critical--yet beyond this there is so much more.
These are the kind of SLOs which deliver detailed insights connected with business value:
- Is the website loading fast enough for users to go back or too slowly, pushing them away before they can find the information they need to perform a task or place an order?
- Are the Apache app servers actually able to process client requests without generating 400 errors?
In both cases, the target service is generally “pingable” but is not able to perform its designated task in a way that is beneficial to the business or the end user.
In OpsRamp’s fall product update, we’ve made it easier to achieve meaningful SLOs and delivered enhanced flexibility for how users create dashboards. While standard curated dashboards for various cloud and cloud-native services are automatically created during the OpsRamp onboarding process, IT pros can now use the open source query language PromQL to create custom dashboards tiles displaying metrics across any number of dimensions and with supremely flexible visualizations. Users can now query and filter metrics based on tags, drastically increasing the metric cardinality in OpsRamp.
Yes availability is always critical--yet beyond this there is so much more.
Using PromQL in OpsRamp can, for example, show:
- The average rest client requests received over all app servers, in contrast to the percentage of 400 errors. This gives users a high level understanding of their service health and if it’s performing as expected or defined in an SLO.
The PromQL to express this would be as follows:
Query A:
sum(kube_rest_client_requests{instance=~".*40.*"}) / sum(kube_api_rest_client_requests_total)Note: We are leveraging a regex expression to filter down request types to those that contain “40”. This regex could be altered to filter for other error types, like 500 server side errors.
Query B:
avg(sum(sum_over_time(kube_rest_client_requests[5m])))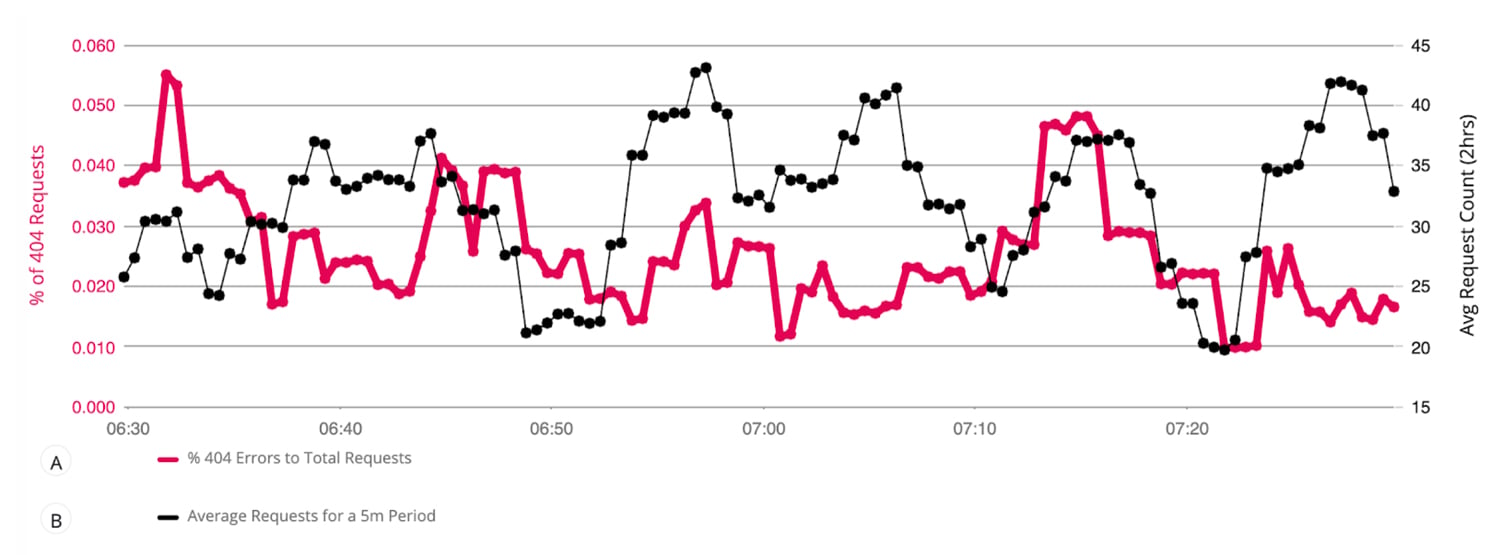
- The .95 percentile of latency of HTTP requests served by Kubernetes hosts. This provides insights into what the upper bound of request latency is across hosts and allows users to spot spikes, or drops across a period a time. The PromQL to express this would be as follows:
The PromQL to express this would be as follows:
Query A:
quantile(0.95, sum by (host) (rate(kube_rest_client_latency[5m])))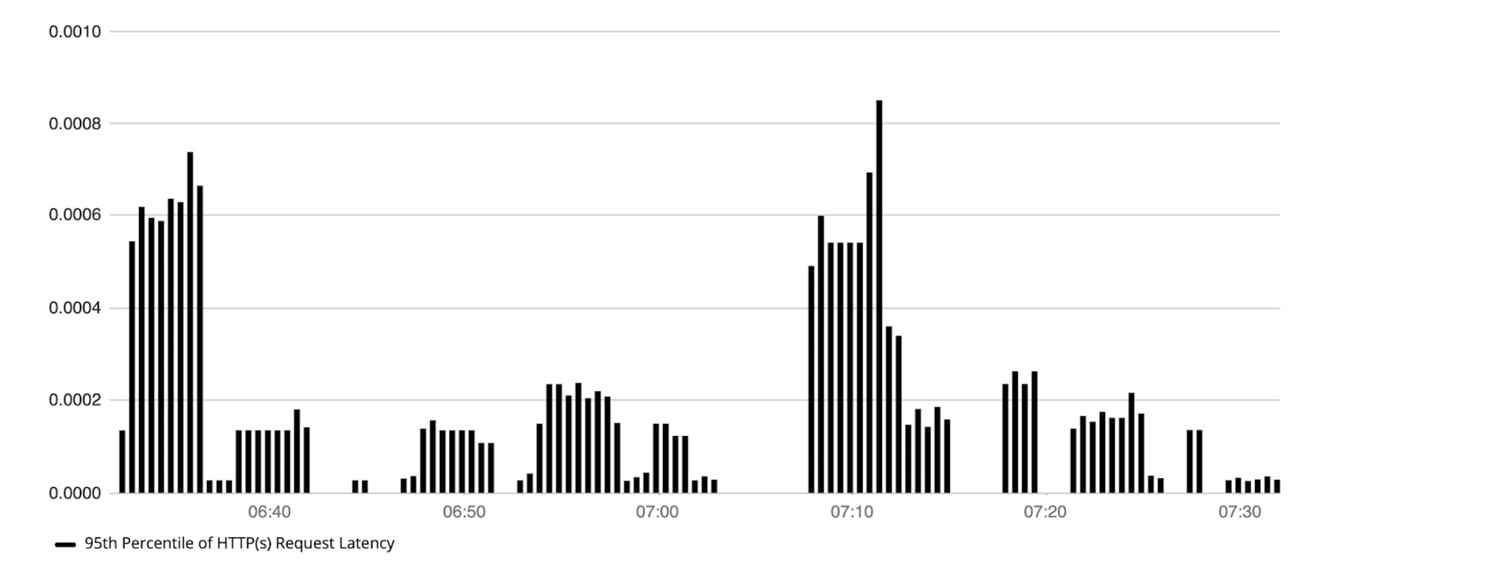
- How many inbound packets were received on hosts with “172” in their IPV4 Address for a given 30 day period. This tells users how much inbound traffic is being transmitted for 30days and allows them to spot any anomalies, such as spikes or drops.
The PromQL to express this would be as follows:
Query A:
sum(sum_over_time((network_interface_traffic_in{ip=~".*172.*"}[30d]))) / (1024*1024*1024)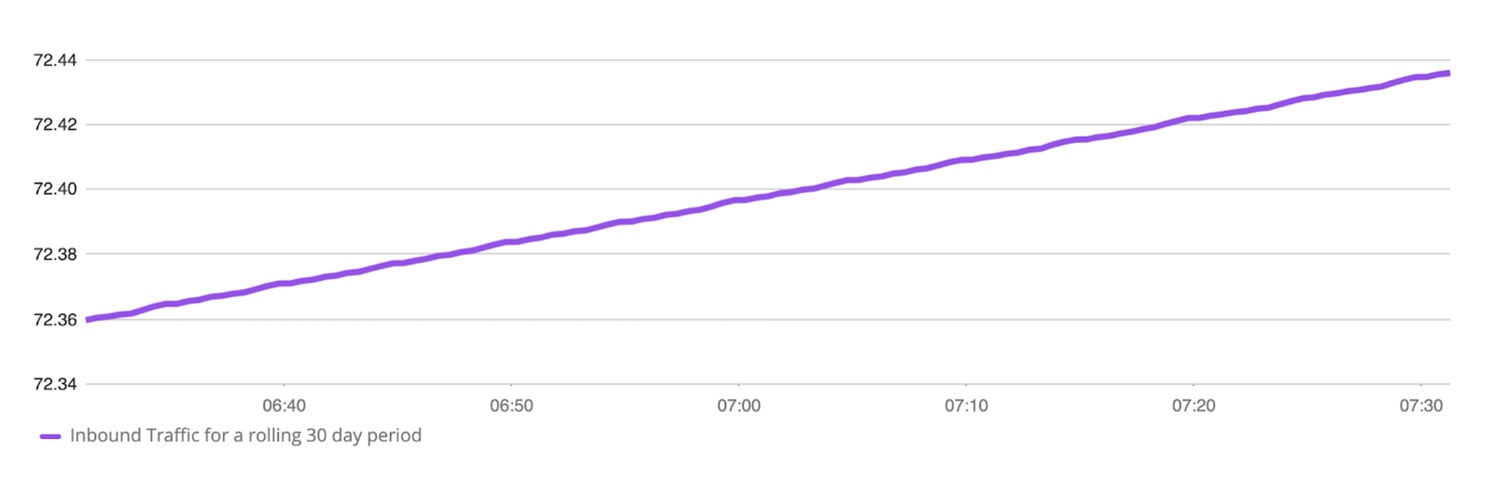
Big Picture Goals with Finer-Tuned Metrics
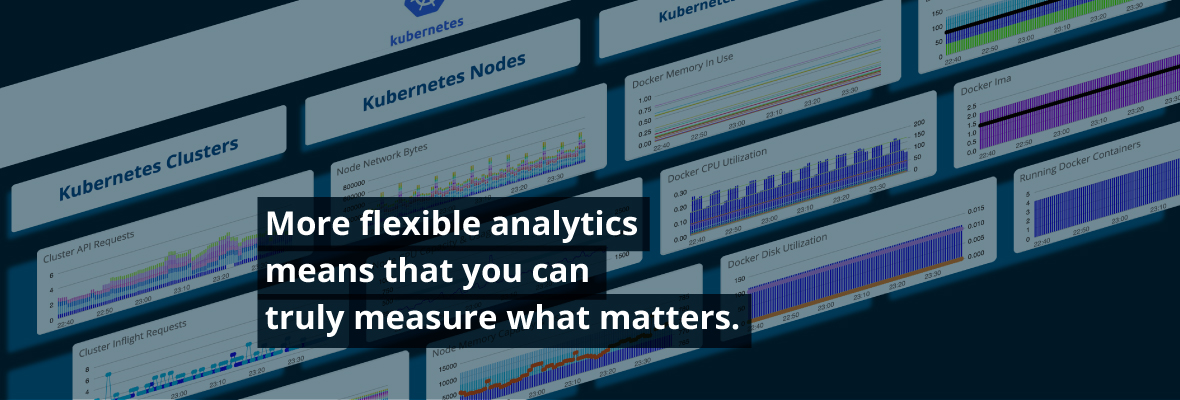
More flexible analytics means that you can truly measure what matters. Users can make queries which represent the overall health of the infrastructure in a single time series, not just indicating that one resource is down. OpsRamp’s Fall Release has changed the precedent for visualizations, giving users the keys to drive more insights with metrics data—and in turn supporting accurate decision-making as concerns foundational IT operations activities like capacity planning and troubleshooting. Great analytics drive better outcomes—and we’re happy to play a role in making user experiences as good as they can be.
Next Steps:
- Read about how OpsRamp enables safe process automation
- Learn more about the OpsRamp Fall Release
- Predictive analytics meets IT Operations