

Enterprise monitoring tools have traditionally paid attention to the performance of monolithic applications hosted on physical and virtual infrastructure resources. The adoption of cloud native and microservices architectures has brought greater focus to end-user experiences delivered by web applications across different global locations.
The bar for a great digital customer experience has never been higher. Google has found 53% of mobile users would abandon a website if a page took more than three seconds to load. It’s been said that “slow is the new outage” (SITNO) as customers expect intuitive, reliable, and stress-free digital experiences or they will switch to a competitor in seconds (or less).
Google has found 53% of mobile users would abandon a website if a page took more than three seconds to load.
Enterprise IT teams need the right levels of visibility to understand if an application is truly serving the needs of their employees, customers, and partners. Synthetic monitoring can help track performance metrics such as page load times and end-to-end latency that can positively influence business outcomes such as user signup rates and transaction completion rates.
Point Tool Challenges
While best-of-breed synthetic monitoring tools can provide some clarity on how users are interacting with an application, they also bring specific challenges:
- Holistic context. IT teams not only need to understand the specific parts of a multipage transaction which are failing but also view the underlying application and infrastructure supporting a digital service.
- Continuous monitoring. Synthetic monitoring should help organizations assess the quality of their digital services across different stages of the CI/CD pipeline including pre-production, staging, and deployment.
- Customer journeys. IT teams need to be able to model synthetic transactions using end-user flows. Application owners need to prioritize what their users care about during a transaction to detect and resolve issues using synthetic checks.
Watch this short video with Michael Fisher, product manager at OpsRamp, who discusses in more detail the synthetic monitoring trend.
Synthetic Transactional Health Visibility with OpsRamp
OpsRamp’s synthetic monitoring goes beyond simple uptime checks to modeling common user interactions and transaction flows to explicit business outcomes. Synthetic monitoring helps organizations confidently assess the state of their web applications with the following features:
- Comprehensive platform. IT operators can measure end-user experience and address performance issues with a broad category of synthetic transactional tests across widely used protocols such as HTTP, HTTPS, DNS, FTP, IMAP/POP3/SMTP/RTT, PING, SIP, SSL, TCP, and UDP.
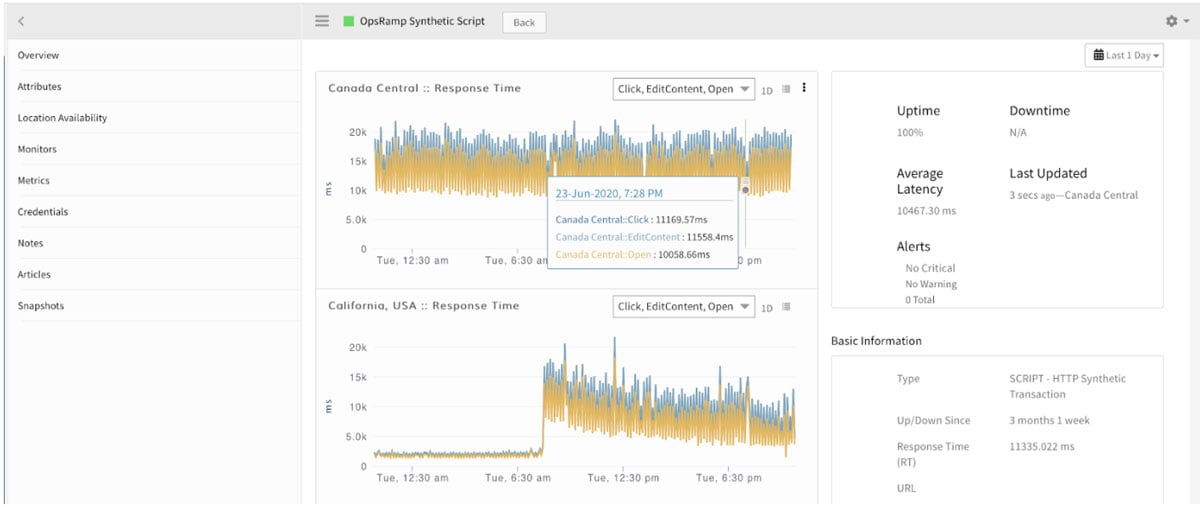
- Multi-step transaction analysis. OpsRamp’s script-based recordings track user experience across multi-step, multipage transactions by measuring response time for different transaction steps and sending alerts in the event of errors. OpsRamp supports 99 distinct actions for each multi-step transaction, offers cross-browser support for Chrome and Firefox, and provides granular replays of simulated transactions. Administrators can logically break down and rename different transaction steps so that they align more closely with the actions that users perform on their website.
- Global locations. OpsRamp can monitor user experience for business-critical services across 10 public locations, including Atlanta, Dallas, Frankfurt, Japan, London, Mumbai, New Jersey, Singapore, Tokyo, and Toronto. OpsRamp also offers synthetic checks for internal applications that are not available through public IP addresses via private location support using gateways.
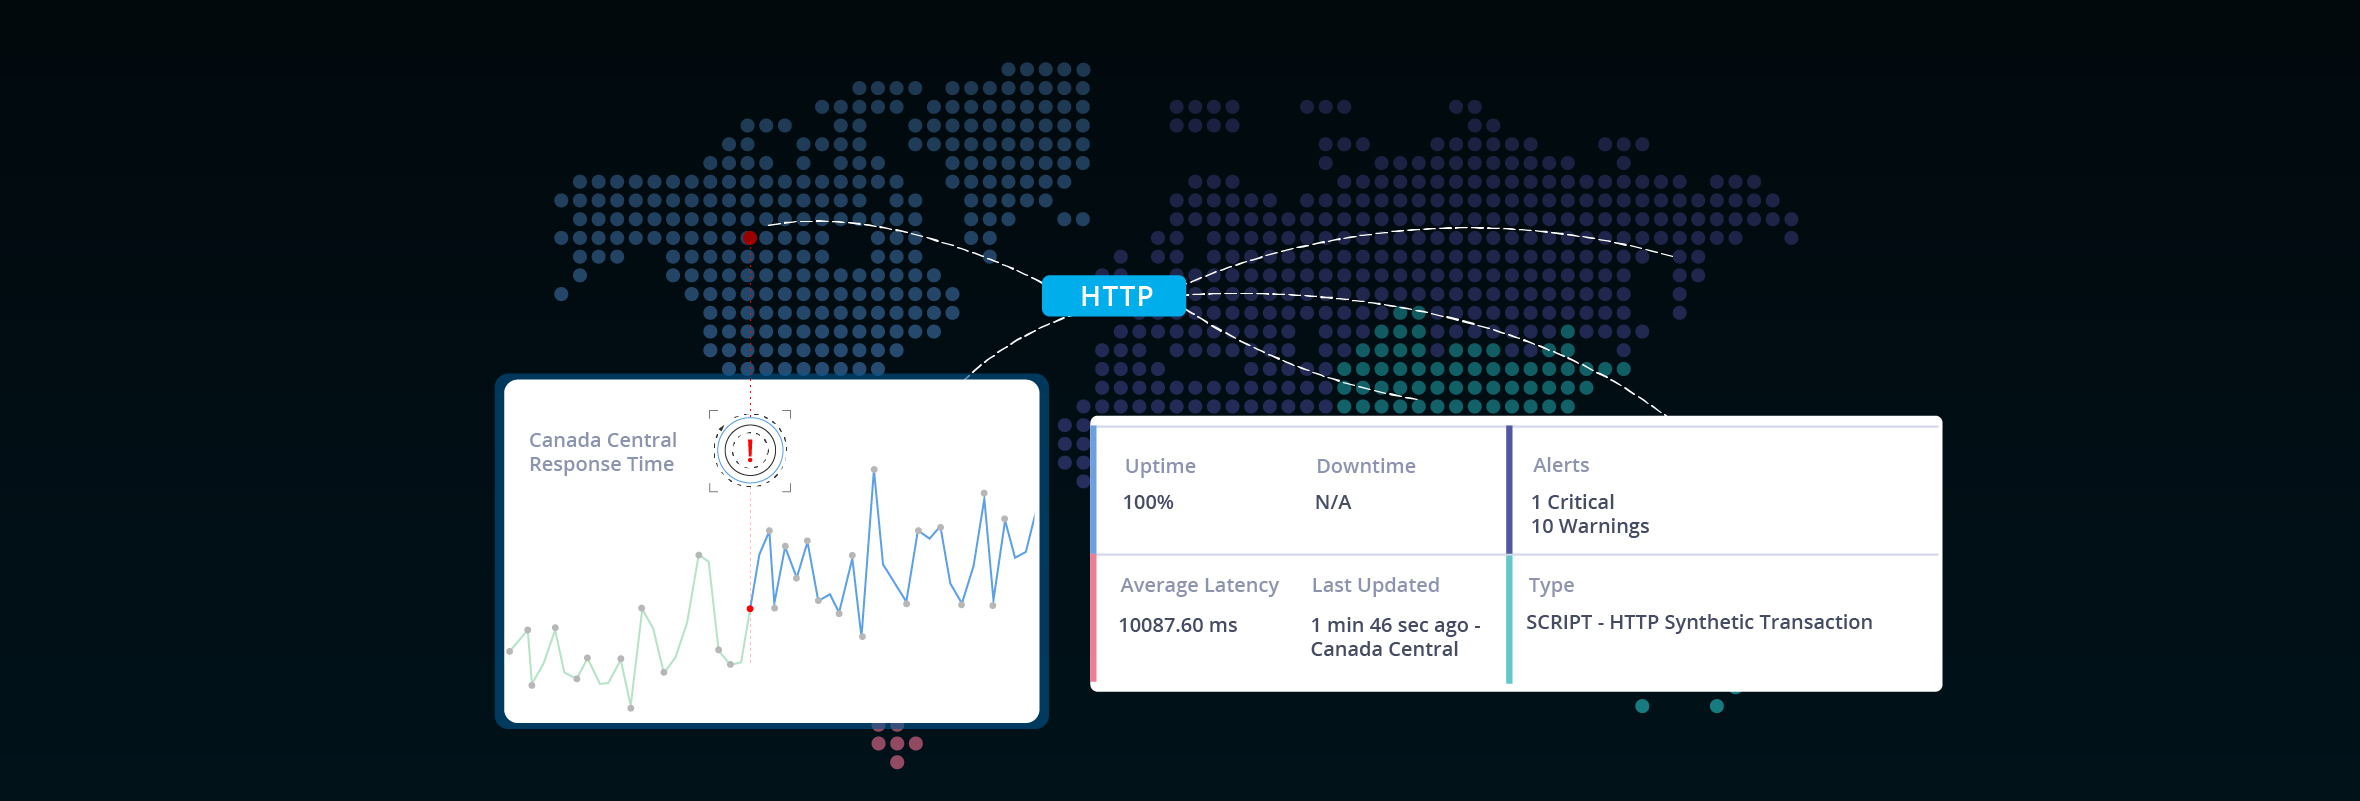
- Dashboards. IT teams can tag a transaction-based synthetic monitor to a dashboard to access critical performance metrics such as uptime, downtime, response time, average latency, and alerts for their digital services.
- Service Maps. Service maps allow IT administrators to logically map a business service to its supporting applications and infrastructure for greater context.
Synthetic monitors help IT teams better understand the performance of web applications and catch issues before end-users are impacted
Benefits of a Platform-Centric Approach
Modern IT operations troubleshooting workflow should center around one major concern: how satisfied are users while interacting with our online services? OpsRamp’s modern IT operations management (ITOM) platform enables IT organizations and service providers to meet user expectations by linking transaction outcomes to business goals. The OpsRamp Summer 2020 release helps accelerate issue resolution at every stage of the troubleshooting process:
- Recognizing issues. Administrators initially try to understand if an issue occurs due to internal (application) or external (such as the Internet) factors. While best-of-breed synthetic tools offer limited problem diagnostics, OpsRamp contextualizes impact across shared enterprise services, distributed infrastructure, and external third-party services.
- Identifying root cause. When IT teams need to pinpoint the reason behind a service failure, OpsRamp visualizes interdependencies between service components, middleware, and hybrid infrastructure for quicker elimination of false positives and better isolation of probable cause.
- Troubleshooting root cause. OpsRamp offers real-time health visibility by breaking down each transaction into individual steps and coordinating incident responses with relevant metrics, topology insights, and contextual notifications.
- Remediating root cause. OpsRamp can handle remediation actions using existing runbook policies or trigger event-driven responses with the process automation engine.
You can learn more about OpsRamp’s synthetic monitoring capabilities in this on-demand TechTalk and access all of our Tech Talks here.
Next Steps:
- The OpsRamp Summer 2020 Release
- IT Operations Management Software Trends
- Learn about the OpsRamp Platform