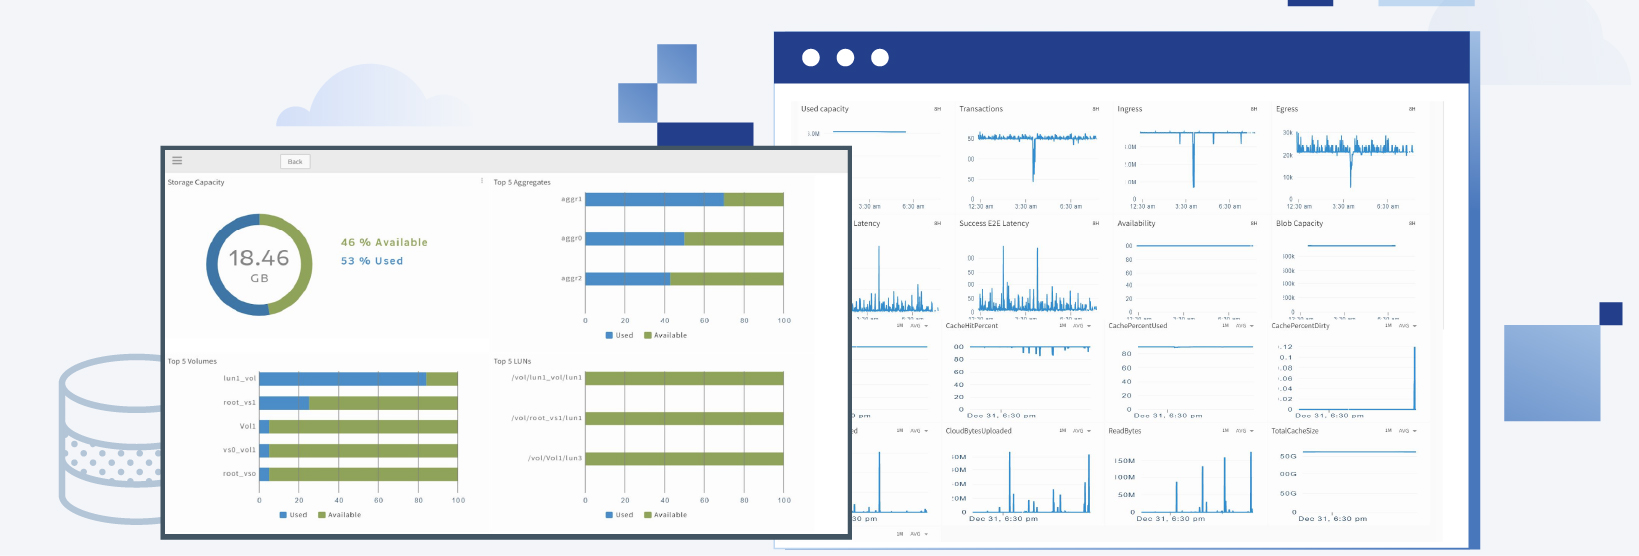
Vistara today announced the release of its latest version, Vistara 3.1, which includes advanced features for unified IT operations management. New features include automated reporting functionality that can be scheduled on a user defined or on-demand basis and support for access controls at a granular level for enhanced security.
With this release, Vistara delivers performance dashboards for popular applications like Microsoft SharePoint and Lync and extends support for popular NoSQL databases and web infrastructure applications. Vistara has also made it simpler to monitor the health of multi-component applications and easier to understand the overall impact of any alert. Finally, Vistara 3.1 offers a straightforward way to manage device SKUs at an enterprise or service provider level.
Scheduled Reporting
Vistara now enables IT administrators to receive reports on a specified schedule or on demand basis via email. Reports can be set up to run on a daily, weekly, or monthly recurring schedule or on demand. Report schedules can be customized per user and users are notified via email of reports that are ready to view.
Role-Based Access Controls at Device, Device Group, and Credential Levels
Vistara offers enhanced access controls at the granularity of a device, device group or credential set. IT teams can assign different users different sets of permissions on the same devices. This feature complements Vistara’s existing multi-tenancy capabilities and further improves the ability to offer common operations management functions as a shared service to multiple lines of business.
Dashboards for Microsoft SharePoint and Lync
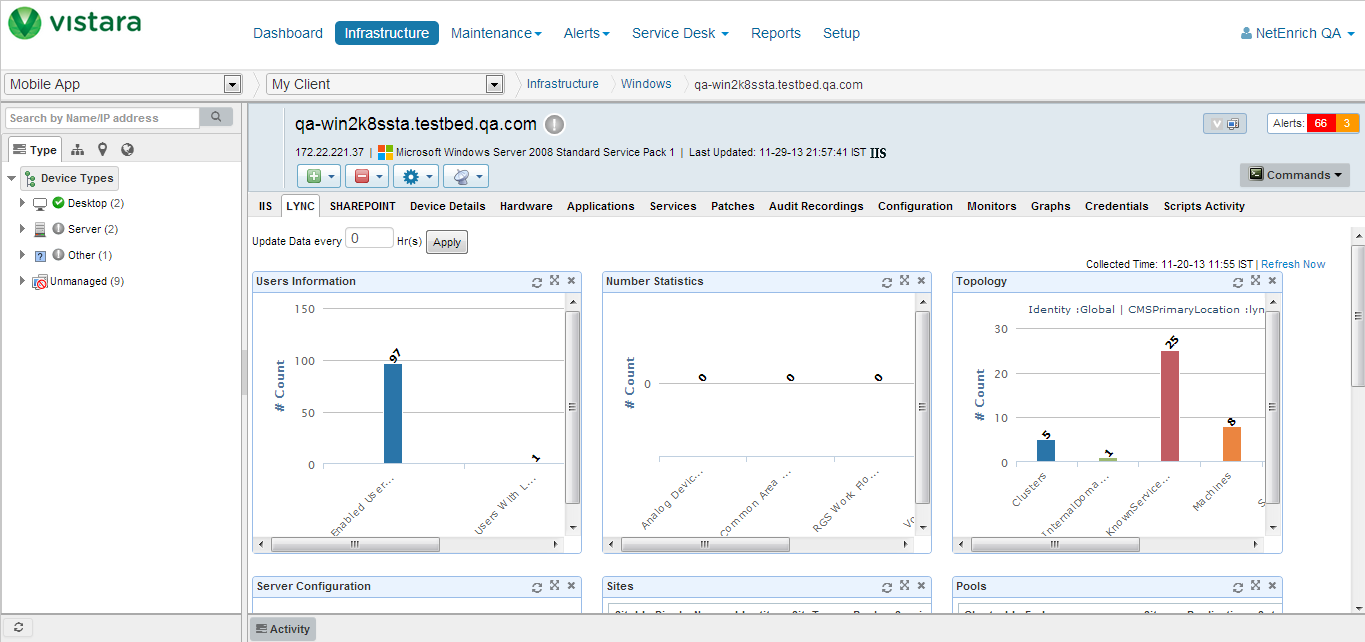
Vistara now adds dashboards for key performance and configuration data for Microsoft SharePoint and Lync to its existing dashboards for Microsoft applications including Active Directory, Exchange, IIS, and SQL Server. The Lync dashboard provides information on server configuration, server roles, service and process information, and user information:
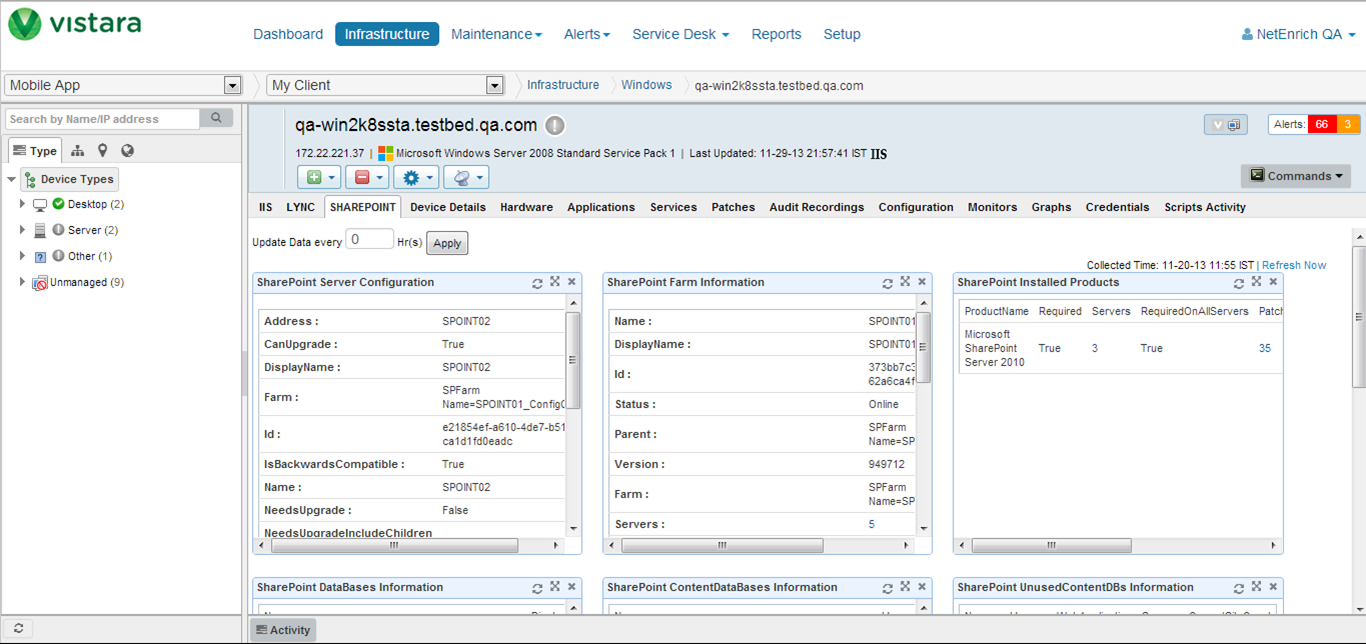
The Microsoft SharePoint dashboard provides information on services and process information, page views per day, most popular pages, number of views by type, and information on each document (size of the document, the number of versions, the size of the versions and the total size) in SharePoint:
Monitoring of Open Source Databases and Infrastructure
Vistara offers monitoring support for popular open source NoSQL databases and web infrastructure applications. In this release we have added support for the following databases and applications:
- Couchbase
- Redis
- Apache ActiveMQ
- Memcache
Custom Metrics for Multi-Component Applications
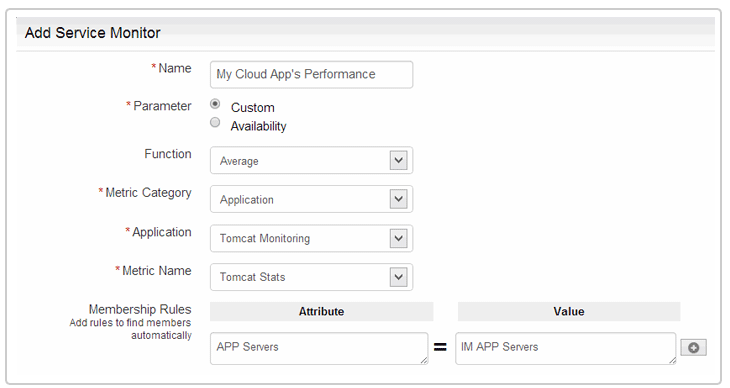
Vistara supports user-defined metrics that represent the availability and performance of applications or devices that make up a single logical IT service. This feature enables the management of complex IT services with custom metrics:
- Define aggregate availability metrics for standby, failover, and redundant components in an IT service.
- Define aggregate performance metrics based on average, minimum, maximum, or sum of component level metrics.
Impact Assessment for Alerts
Every alert in Vistara now comes with detailed information that helps system administrators decide the impact of the alert. Impact information for an alert includes:
- Device groups to which the device belongs.
- Sites to which the device belongs.
- Services in which the device participates.
- The service level associated with device.
Simplified SKU Management
Enterprise and partner users can now manage SKUs across clients’ devices. Partner users can quickly assign/un-assign SKUs to client devices and a new report displays the SKUs assigned to each client. SKU management enables service providers and enterprise IT operations teams with multiple clients to track SKUs across clients.


