

The Truth Is In the Context
Operational dashboards help IT teams gain contextual visibility on the health and performance of critical IT services and underlying infrastructure. While domain-specific monitoring tools offer graphs and charts, siloed monitoring can’t truly deliver the situational awareness that you need (What’s really going on in my IT environment right now?). Monitoring dashboards also can’t provide meaningful metrics for your different business and IT users - which is why most users tend to rely on their favorite tool for analysis and decision making.
OpsRamp’s dynamic dashboards break down organizational silos and deliver instant visibility with custom metrics and performance indicators for hybrid IT services. DevOps teams, subject matter experts, application owners, and business executives can use our powerful and customizable dashboards to combine data from multiple sources and troubleshoot issues with confidence.
Access Breakthrough Insights With Dashboards and Widgets
The OpsRamp Digital Operations Command Center natively collects telemetry data for hybrid services and combines events from third-party IT management tools for real-time performance visibility. OpsRamp’s dashboards let you group trends and patterns for a specific IT service so that you can quickly identify issues without needing to consult an expert.
Our dashboards and widgets are pre-built and highly customizable so that you can reduce finger pointing and establish root cause(s) across thousands of data points. OpsRamp provides several out-of-the-box dashboards and widgets for proactive monitoring and IT operational effectiveness:
| OpsRamp Widgets | Use Cases |
|---|---|
| Active Consoles | Audit Trails: Track login activity and access history for secure remote consoles. |
| Activity Log | |
| Alerts Trend | Alert Management: Drill down and view real-time and historical system alerts for your hybrid IT infrastructure. |
| Alerts Volume | |
| Antivirus Status | Antivirus Management: Monitor the status of your antivirus protection. |
| Inventory By OS | Asset Visibility: Access the list of assets by OS, device model, and the number of hybrid resources managed by OpsRamp. |
| Inventory By Type | |
| Device Count Widget | |
| Cloud Cost Insights | Cloud Cost Widgets: Analyze your multi-cloud spending across applications, business units, and cloud providers. |
| Cloud Cost Trends | |
| Inference Engine | Event Correlation (AIOps): View all the raw events generated, actionable alerts after deduplication/suppression, and inferences created after the application of machine learning. |
| Integration Failure by Activity | Integrations: Access integration failure activity for active integrations configured in OpsRamp. |
| Network Backup Status | Network Configuration Backup: Check if your network configuration backups have been archived or not. |
| Pending Patch Approvals | Patch Management: Understand which patches are still in approval mode, the status of patch installation jobs, and which resources are under scheduled maintenance. |
| Patch Status | |
| Scheduled Maintenance Status | |
| Device Availability | Resource Widgets: Access detailed information about device and device group availability and consumption graphs for CPU, disk, and memory utilization. |
| Device Groups Availability | |
| Distribution By Metric | |
| Site Availability | |
| Top Metric Utilization | |
| Forward Schedule of Changes | Service Desk: Learn about incidents, problems, changes, activities, and SLA details at various stages of the incident lifecycle. |
| Service Desk Widget | |
| Service Availability | Service Level: See the status of your services based on service maps defined in OpsRamp. |
| Service Status | |
| Metric Value Widget | Custom Widgets: Create your own widgets based on business needs. Build widgets by combining multiple metrics or assemble special widgets (Text and Image) for presenting information in a visual format. |
| Metric List Widget | |
| Time Series Widget | |
| Text Widget | |
| Image Widget |
Take Control Of Your IT Operational Data With Role-Based Dashboards
Role-based dashboards deliver a heads-up display of a user's most important metrics as soon as they log into OpsRamp. You can build a new dashboard in minutes and there are no limits on how many dashboards you can create within OpsRamp. Access strategic insights on the state of your infrastructure with performance metrics in the form of tables, lists, and graphs.
Real-time dashboards help you define and measure the performance and responsiveness of IT services that matter to your business. You can build shared and private dashboards and display them in carousel mode for your multi-monitor NOC setups. Dashboards let you filter data across different time ranges (from less than one minute to a year) or drill down from a service to underlying workloads. Here are four OpsRamp dashboards that provide you with relevant IT infrastructure insights in a single place:
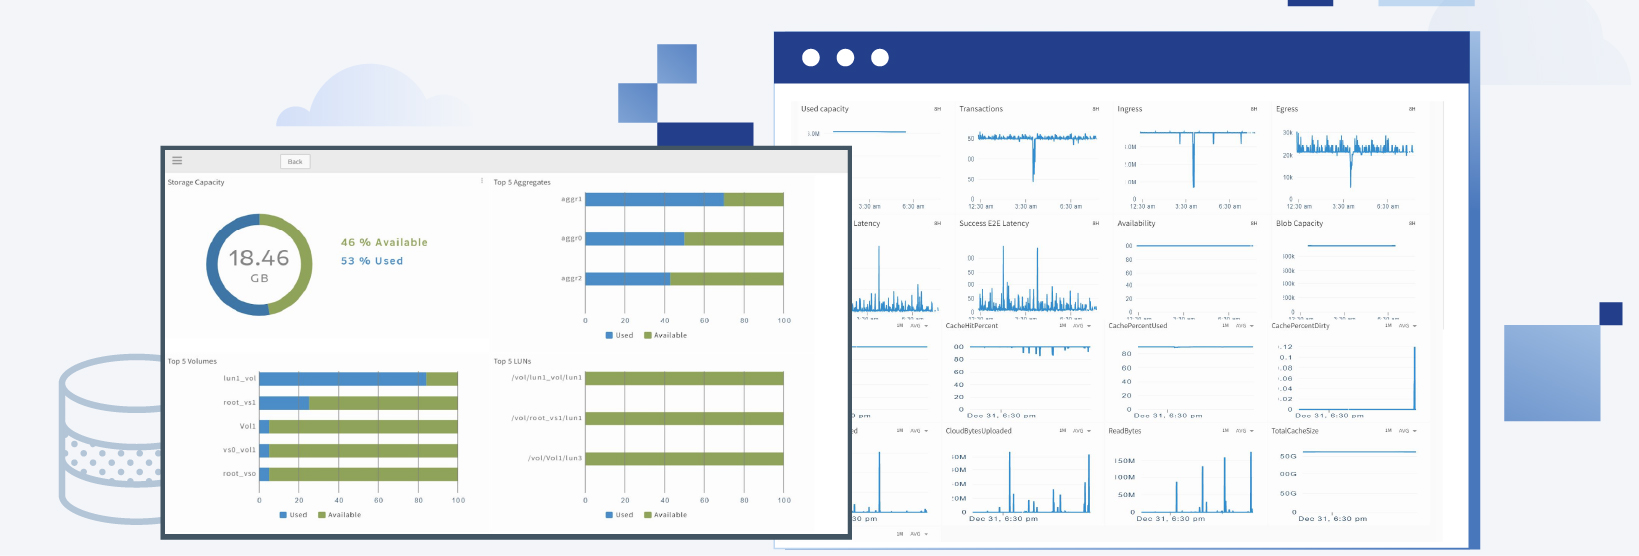
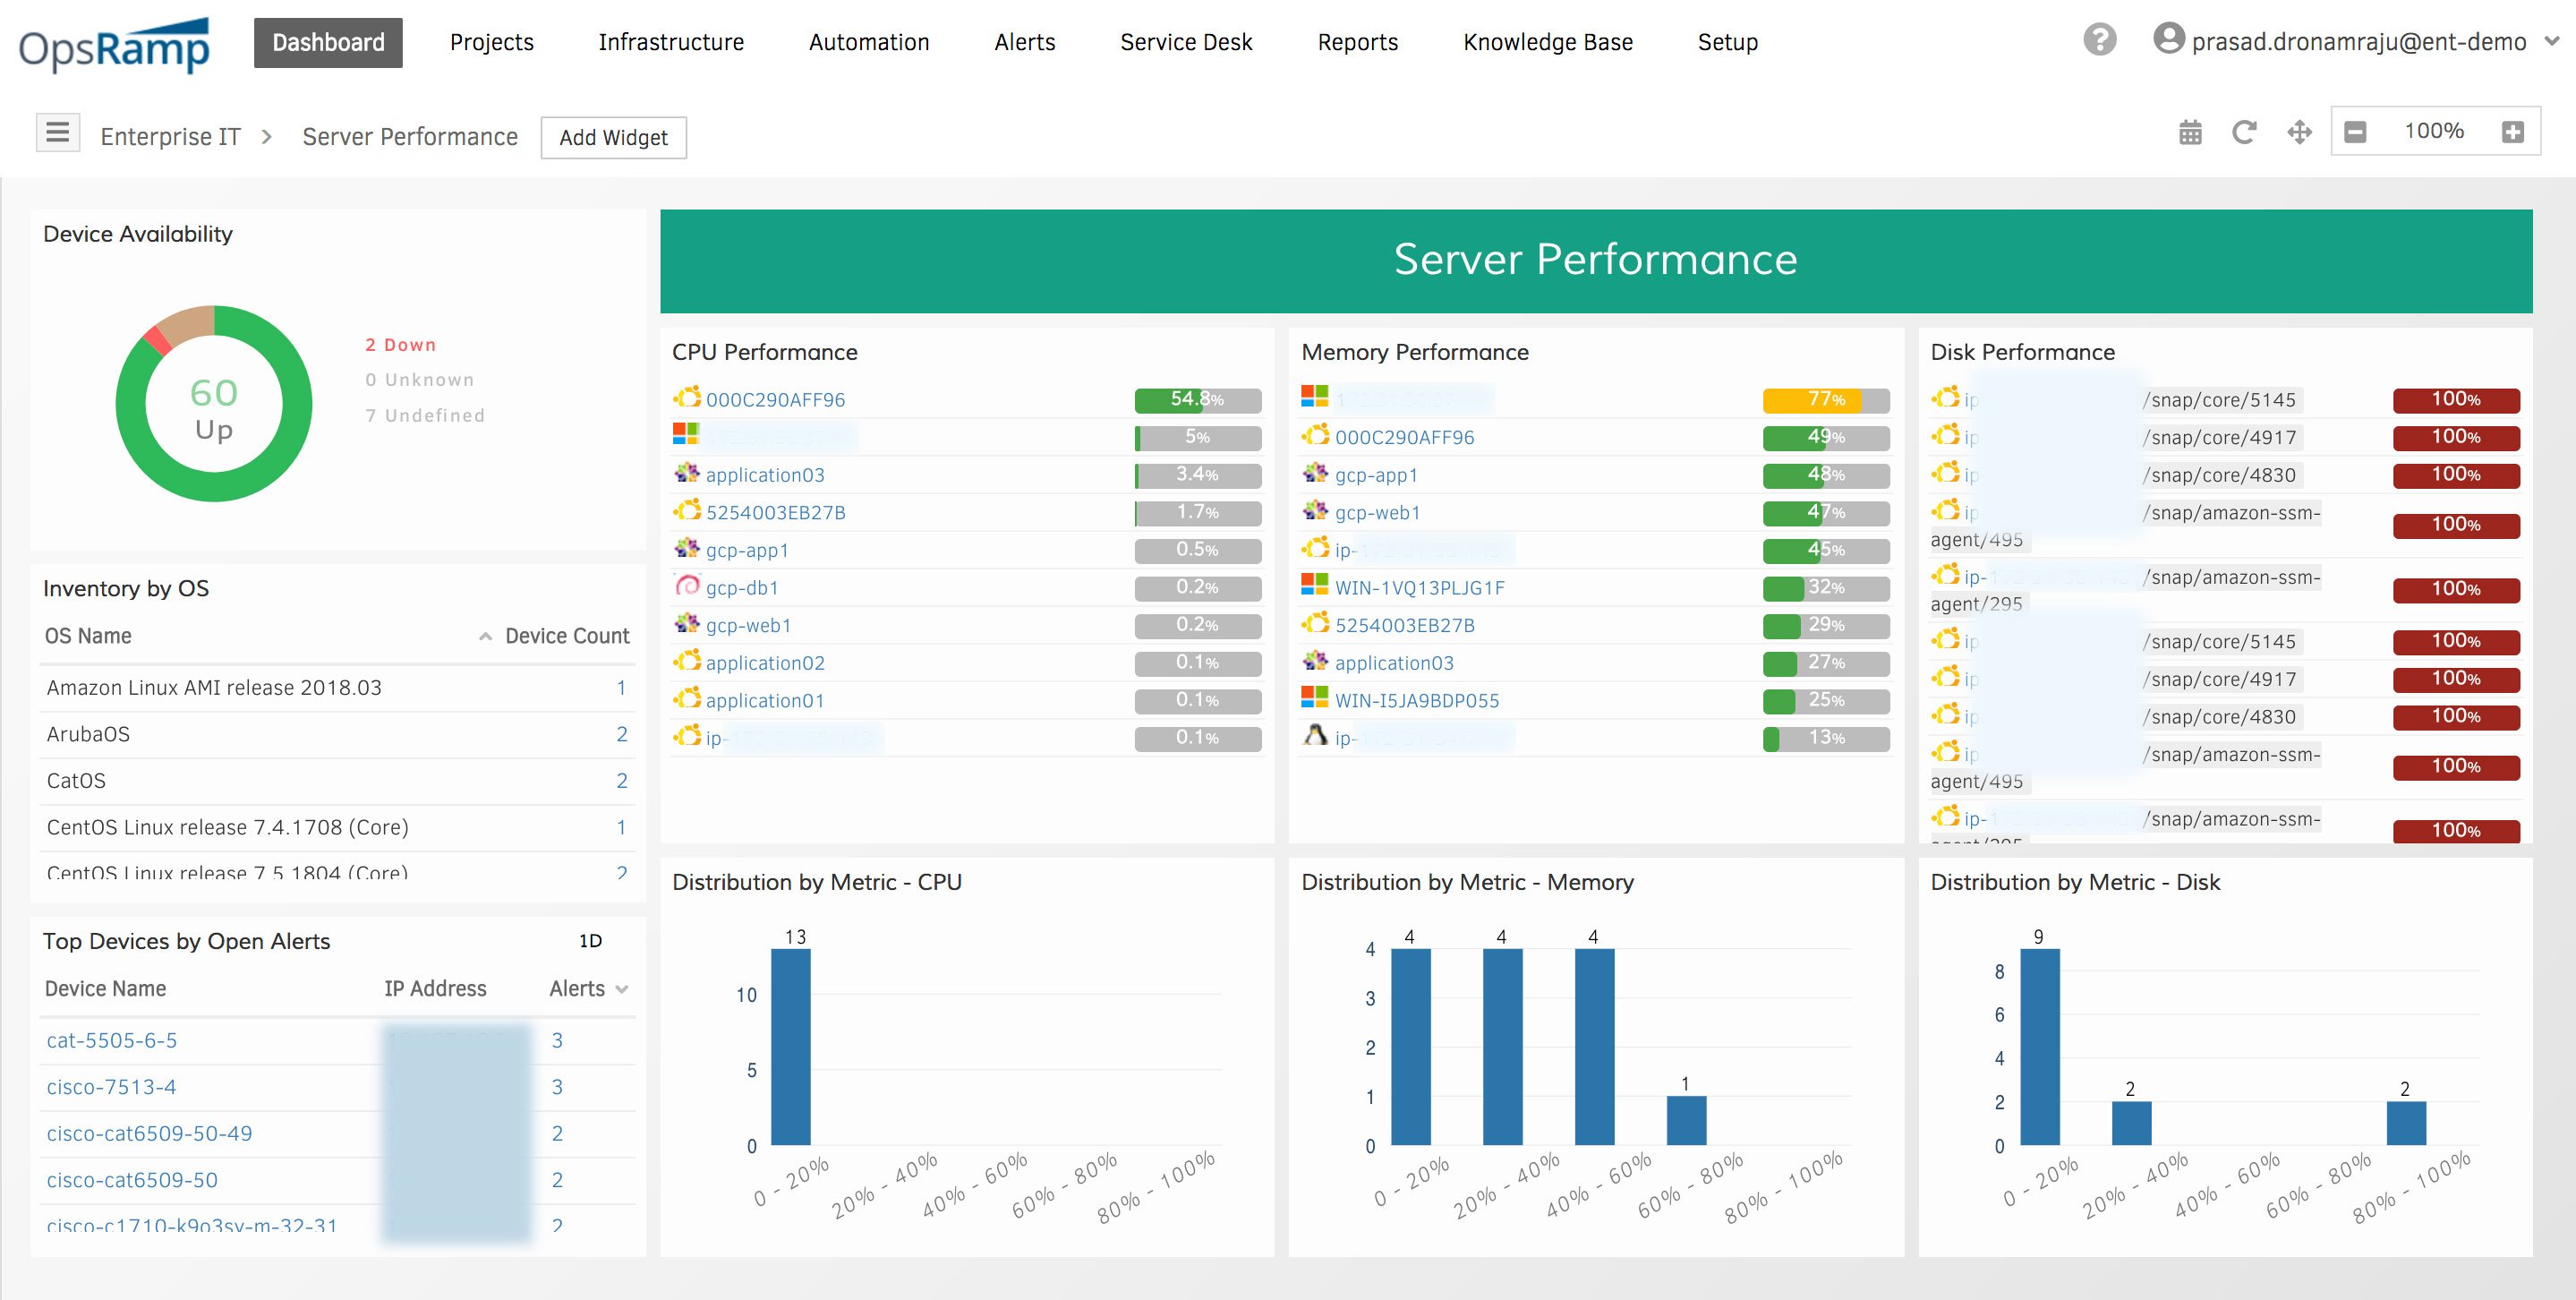
Availability and Performance Dashboard: Access key performance indicators for your datacenter and cloud infrastructure services in this dashboard.
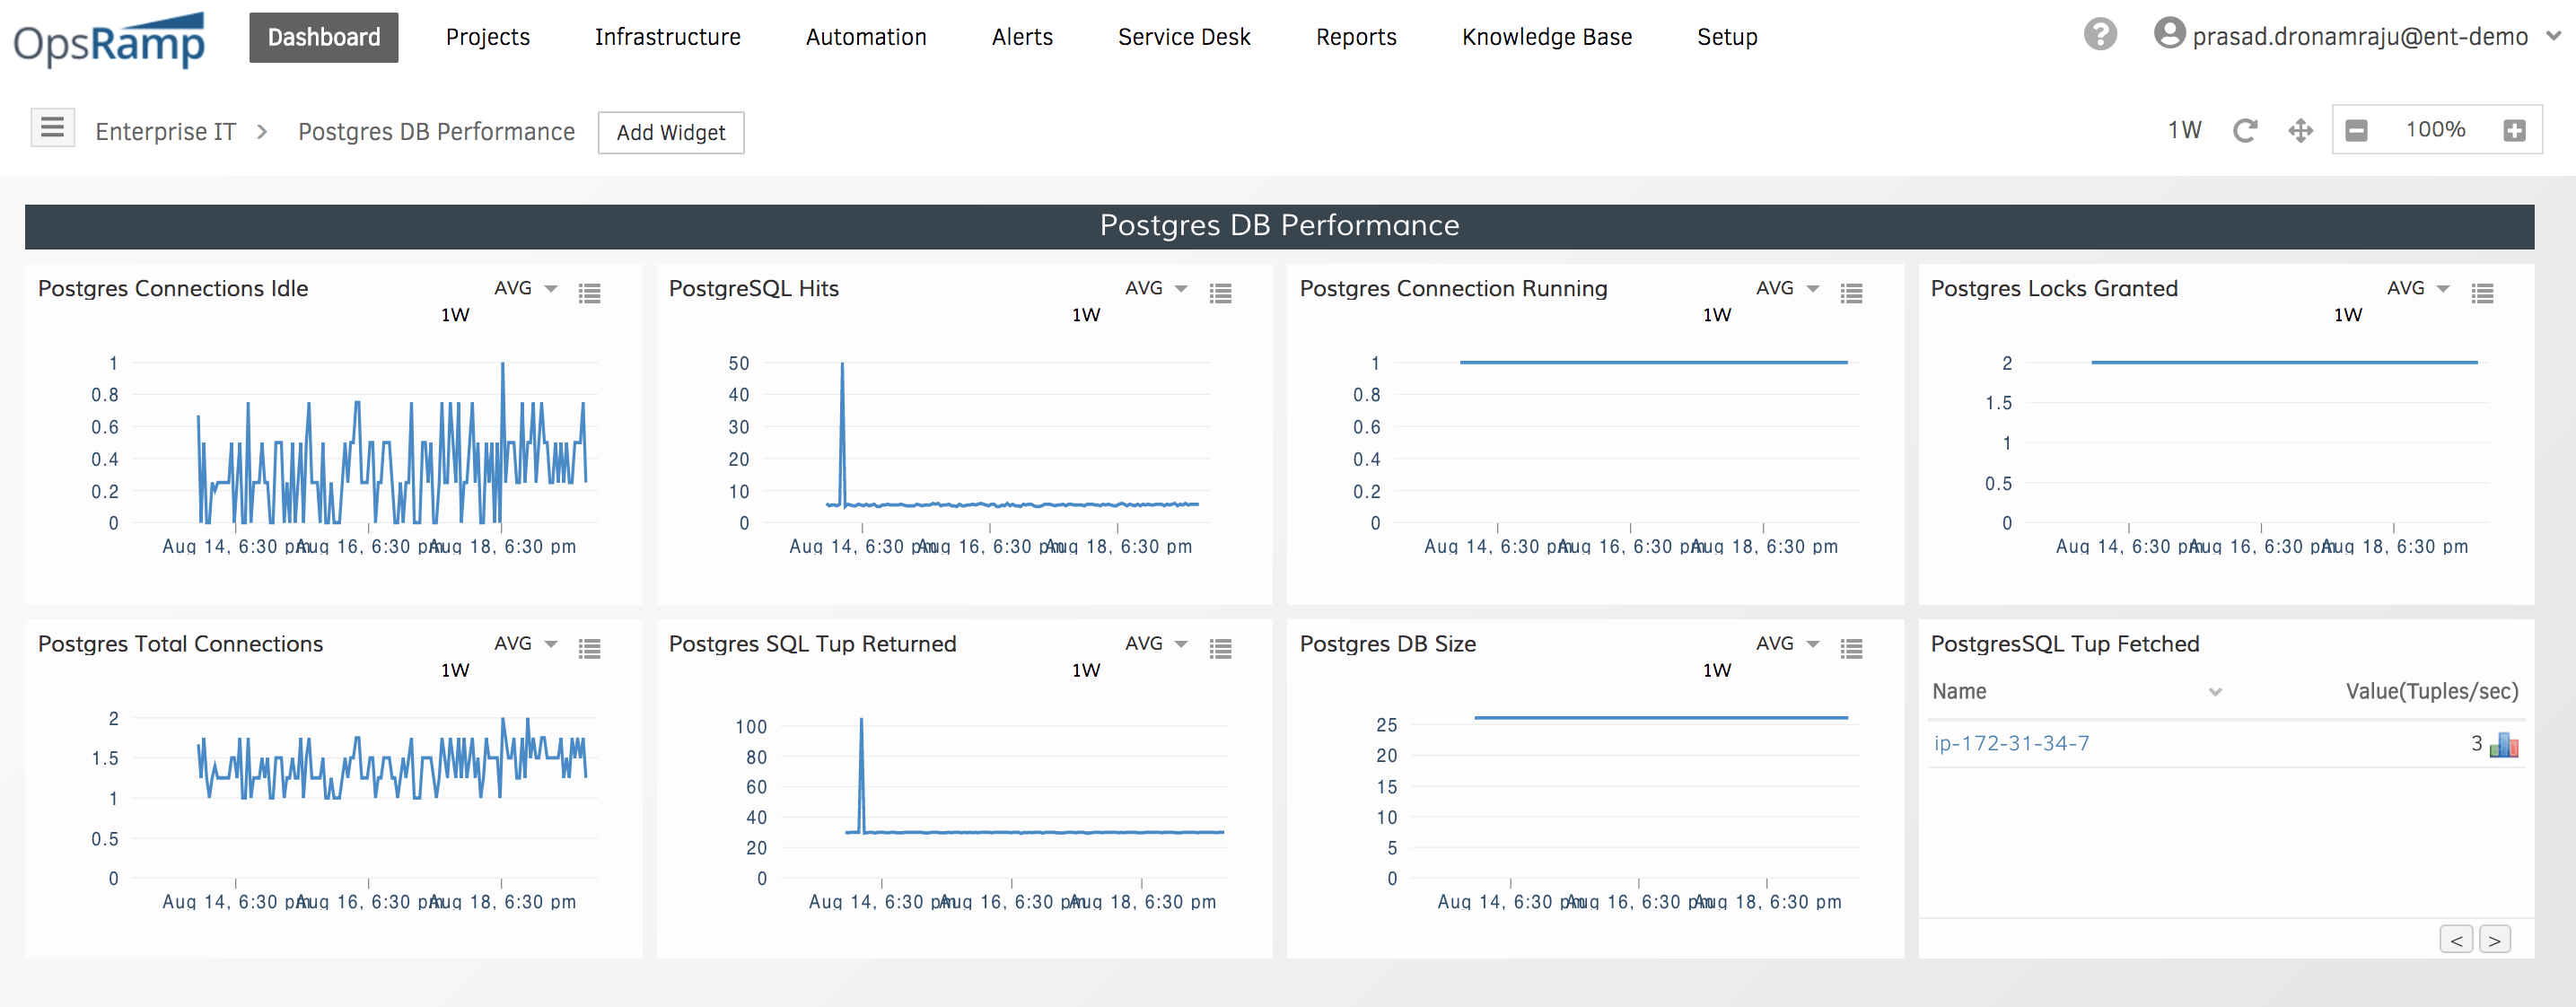
Database Performance Dashboard: Visualize and manage PostgreSQL database performance with intuitive and actionable charts.
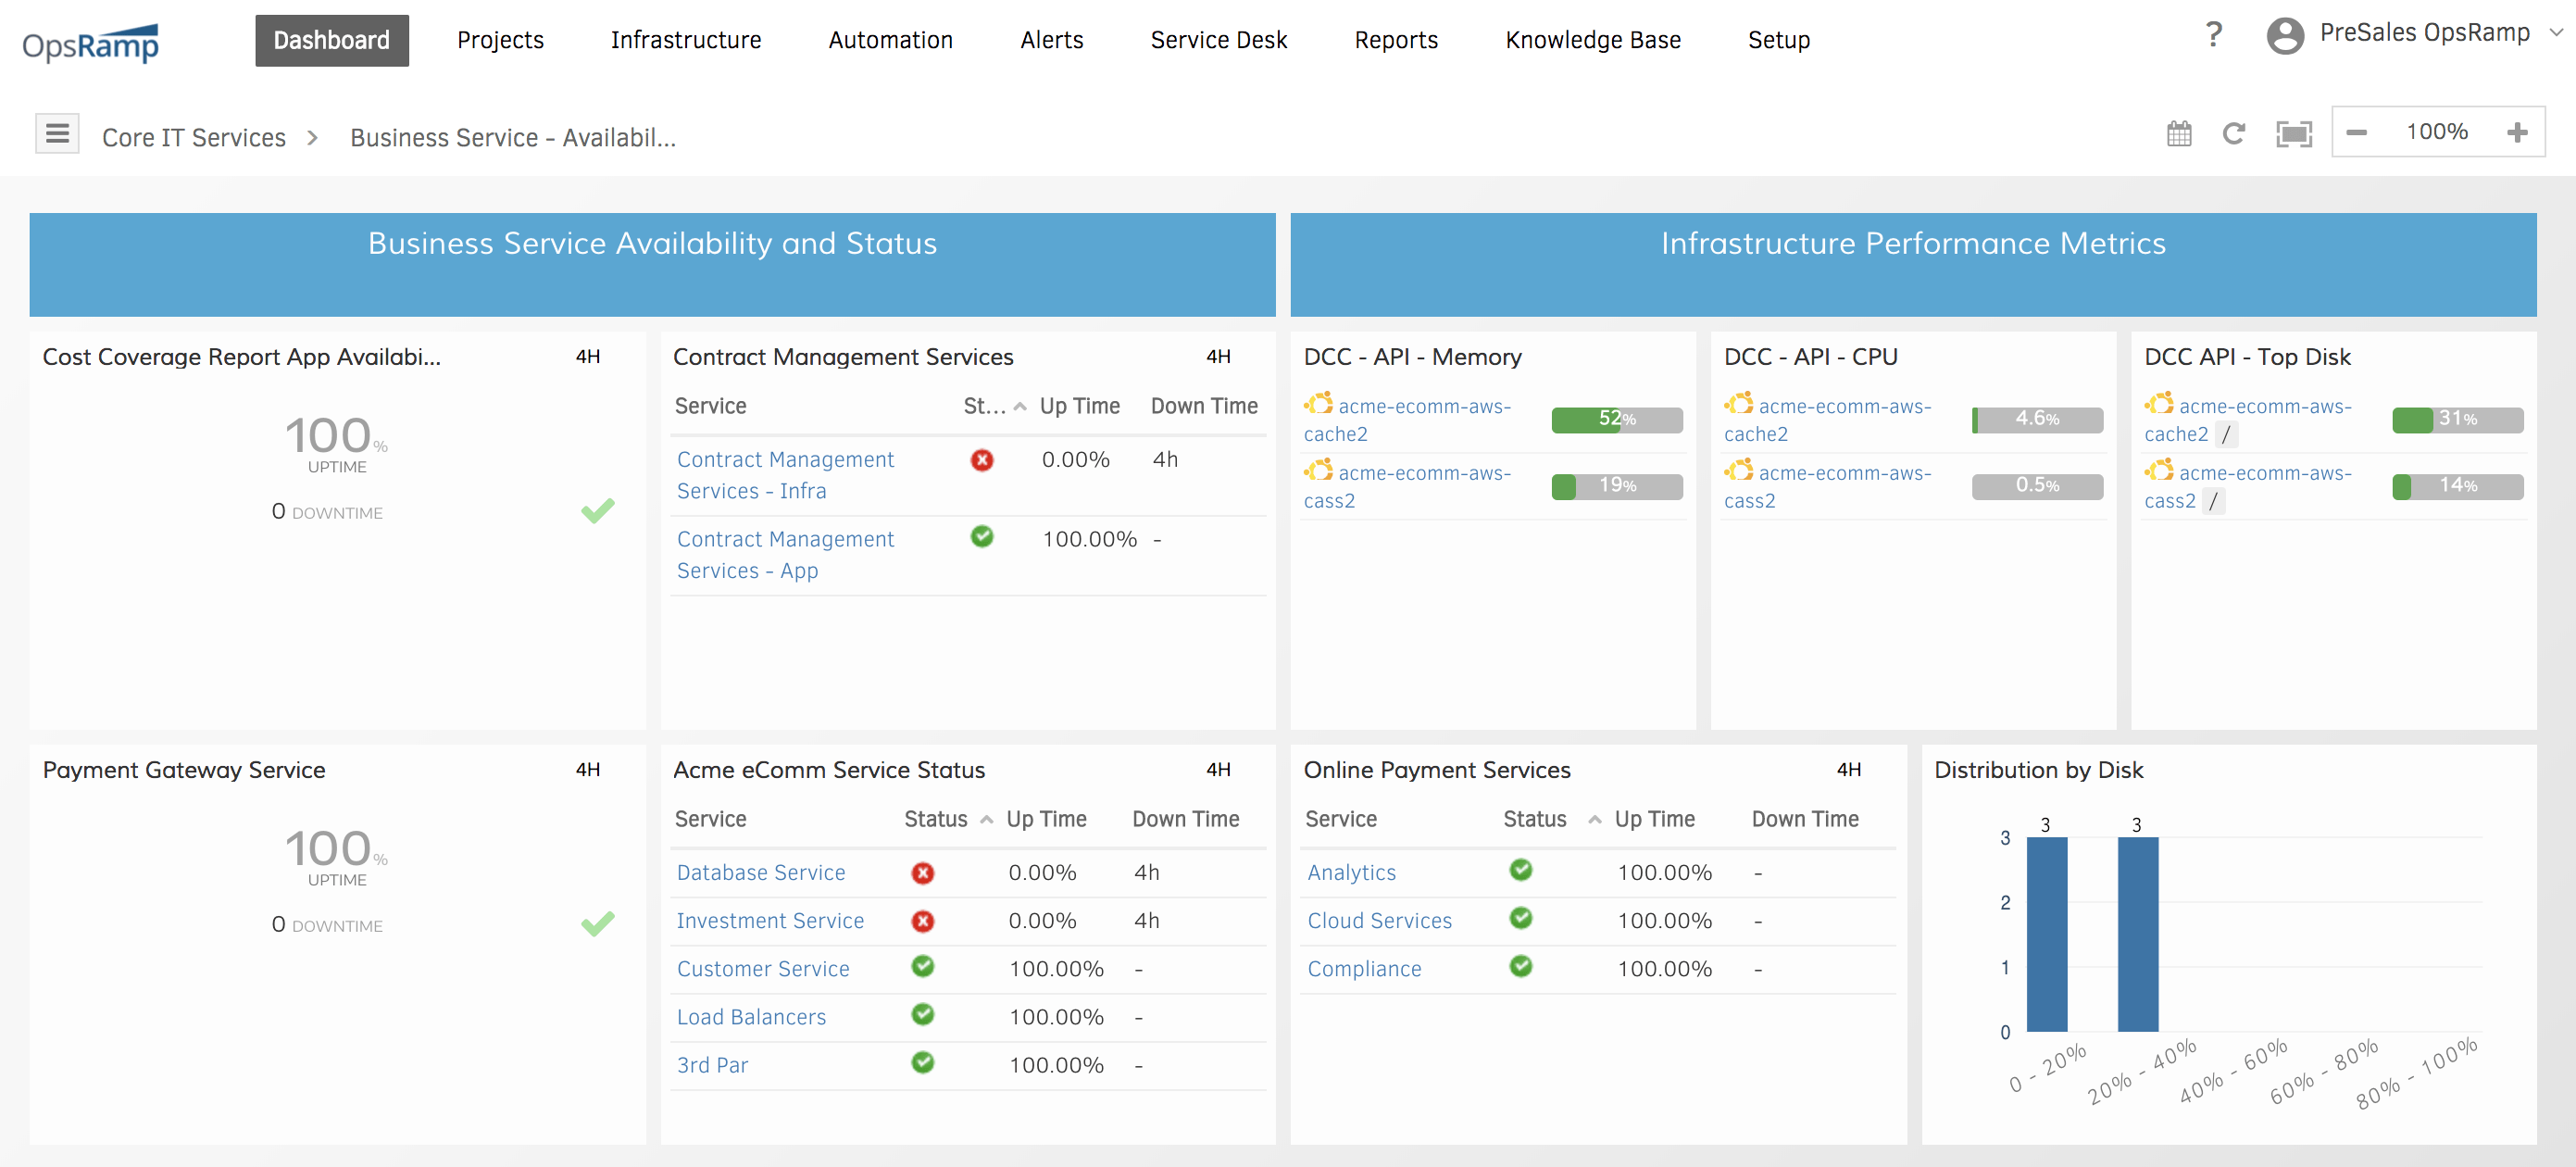
Business Service Availability Dashboard: Monitor the availability, performance, and status of individual business services for a composite service.
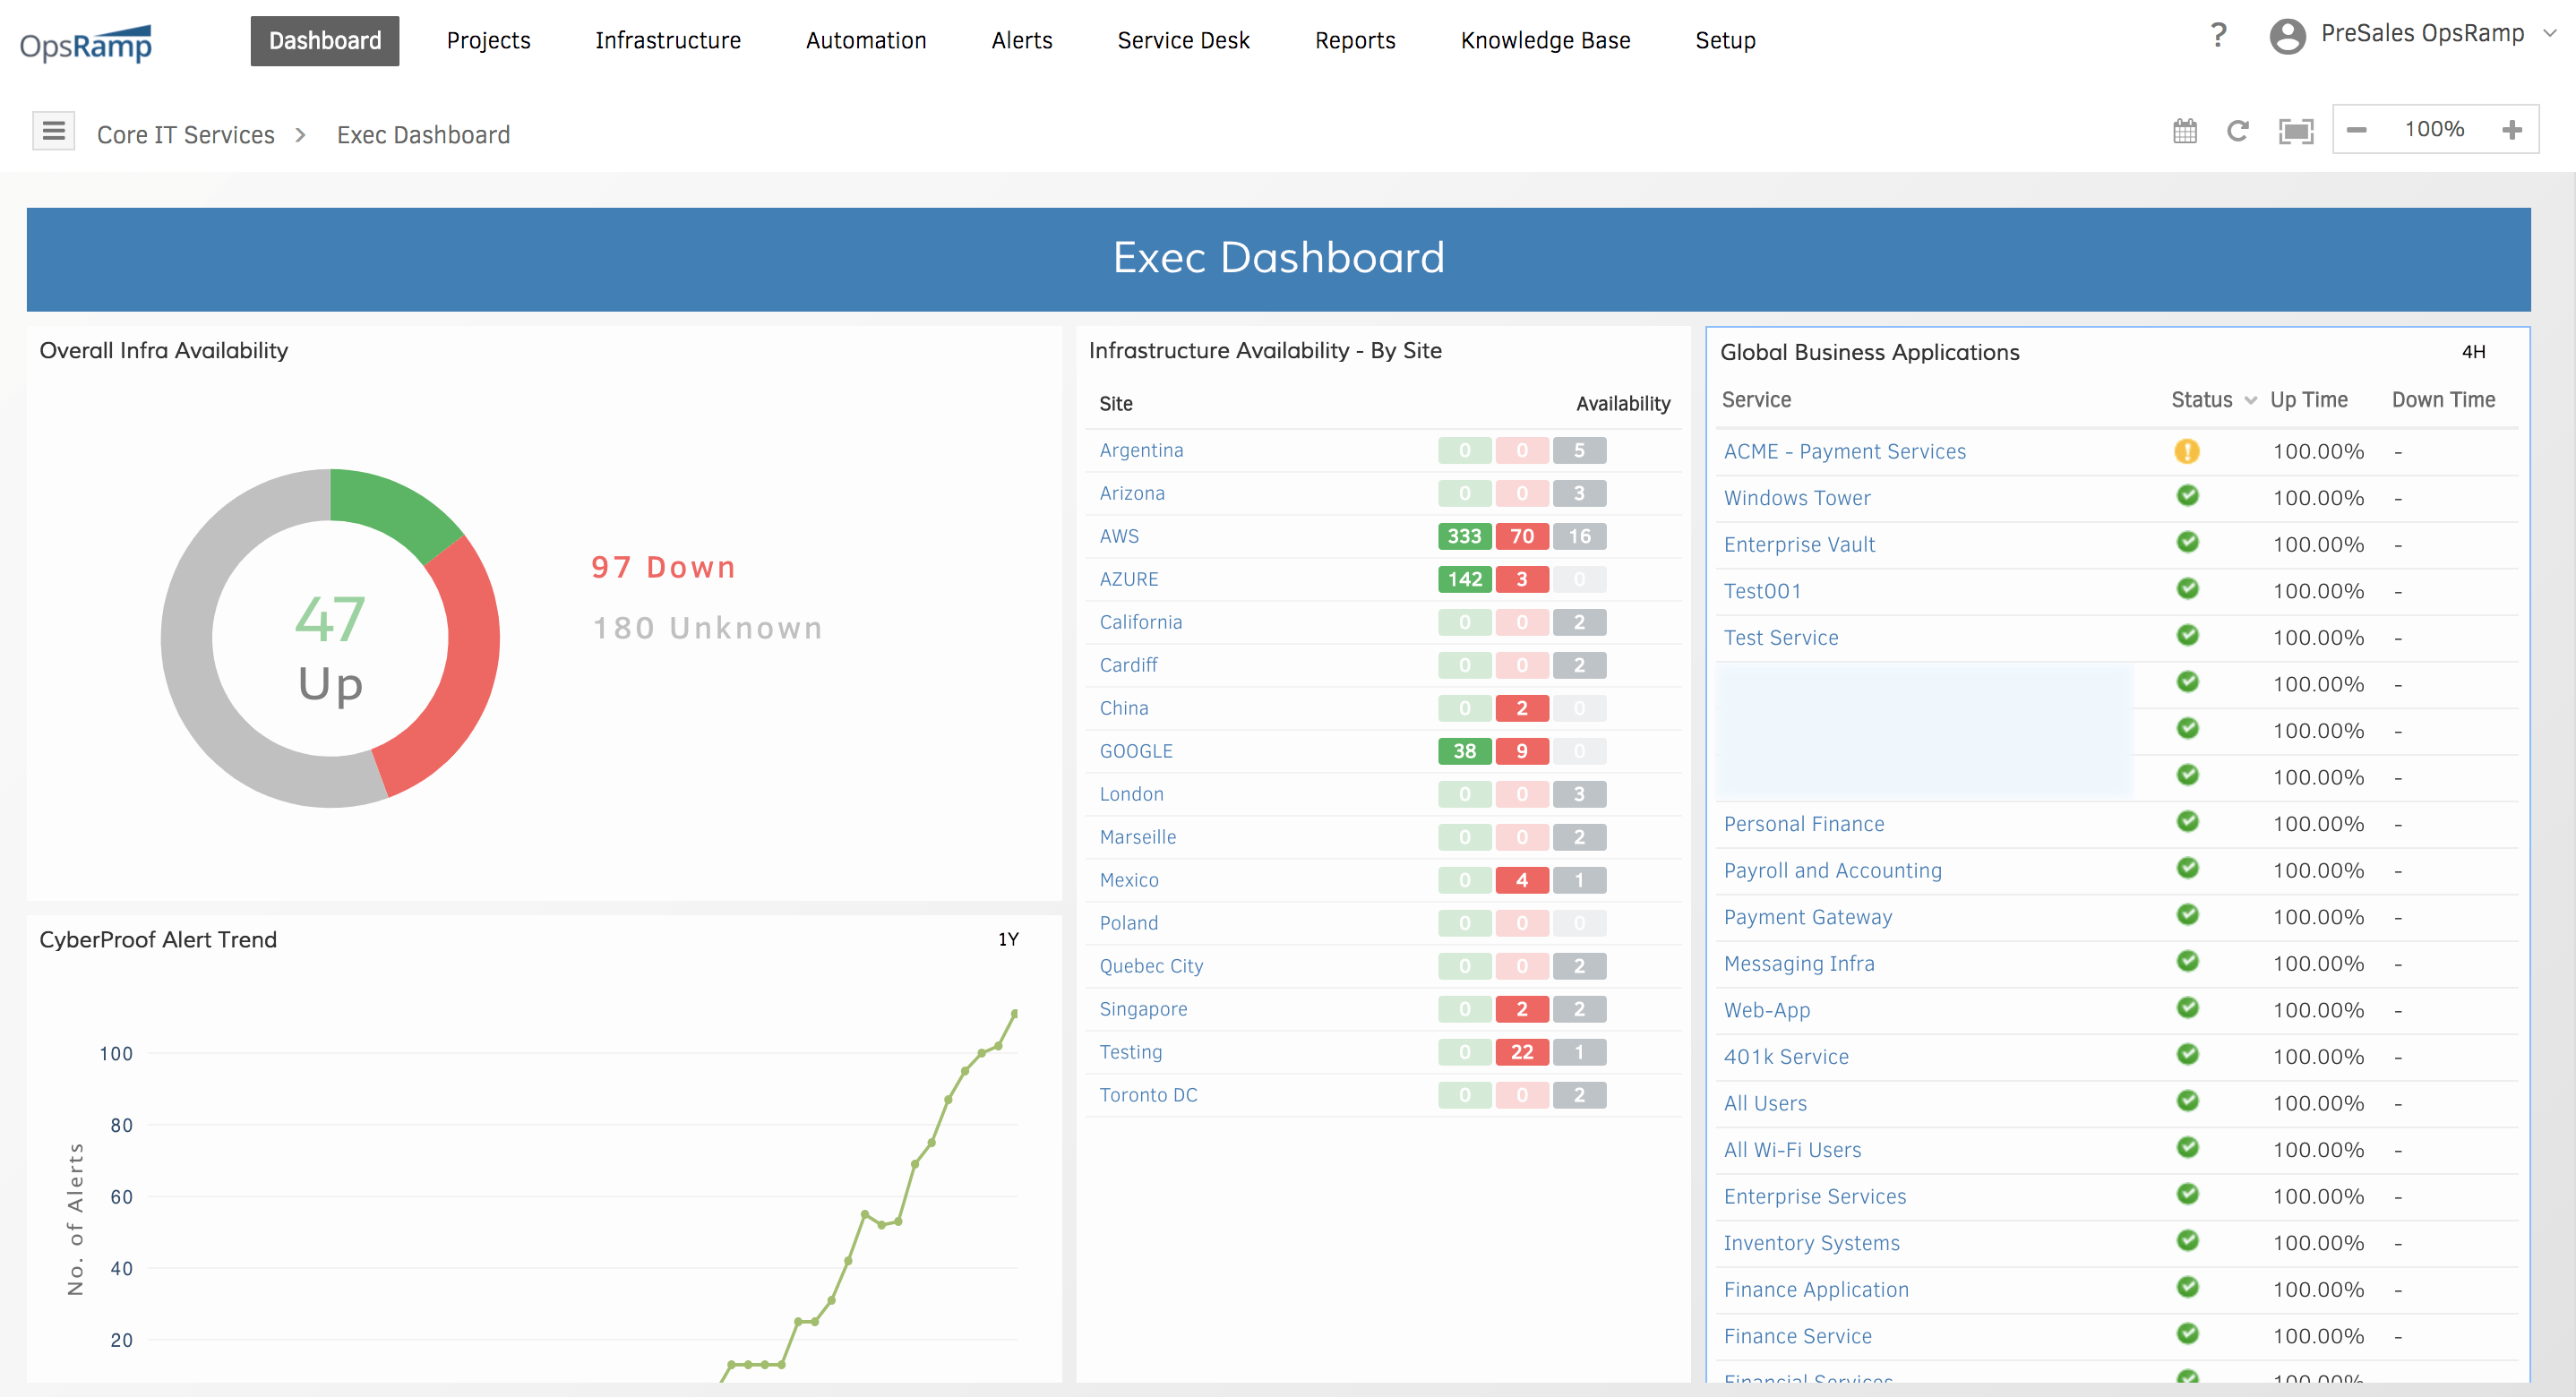
Executive Dashboard: Provide CIOs and other IT leaders an at-a-glance visibility into IT service and infrastructure performance with our multitenant platform.
Next Steps:
- Learn how to control the chaos with a Digital Operations Command Center.
- Check out our tech talk on Scaling Digital Operations with AIOps.
- Schedule a custom demo with an OpsRamp solution expert.
![[Report] Top Trends In AIOps Adoption](https://blog.opsramp.com/hs-fs/hubfs/Blog_images/AIOps%20Adoption%20Report%20/CTA-AIOps-Adoption.jpg?width=1180&name=CTA-AIOps-Adoption.jpg)