When your job involves managing an IT operations platform like OpsRamp, you face unique challenges. Thousands of customers rely on OpsRamp to manage their business critical apps and infrastructure. Each day, we manage new devices, infrastructure services and IT tools in our platform. And, we need to do this while maintaining a service level availability of 99.99%.
What’s our secret sauce for hyperscale SaaS operations? Well, it's simple. We use the OpsRamp platform to manage our own SaaS scale operations across North America, Europe and Japan.
How does our SaaS Ops team drive platform scalability, reliability and security? OpsRamp ensures the availability and performance of our SaaS platform using dashboards, policies, service desk, knowledge base and integrations.
Custom Dashboards
Dashboards display how the SaaS platform performs at any given time. Our SaaS Ops team sets up different dashboards to understand overall platform health. For example, the US region dashboard shows device count, service availability, and device performance.
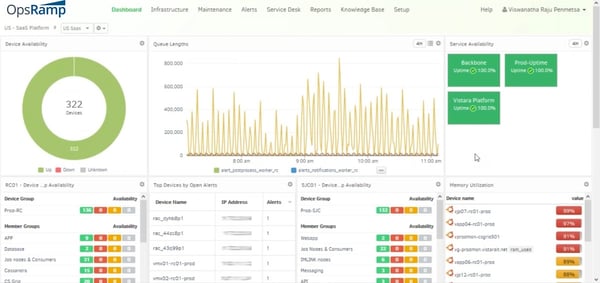 Figure 1 - US Region Dashboard
Regional and service level dashboards help us manage platform uptime and performance. Dashboards monitor not just applications but also APIs, big data clusters, and even alerts and tickets! We manage availability for critical services by tracking relevant metrics for device, memory and CPU usage.
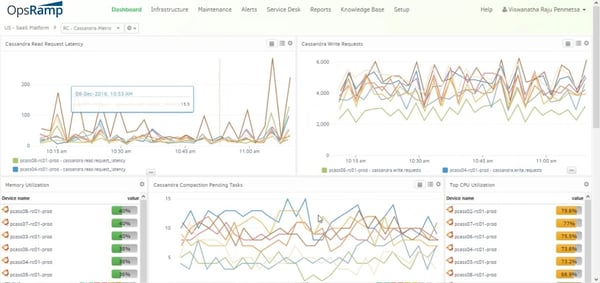
Figure 2 - Big Data Cluster Dashboard
Our big data dashboard tracks read and write request latencies, memory use, compaction pending tasks, and top CPU usage devices for the big data cluster (Cassandra, Kafka, Hadoop).
Device Groups
We segregate our SaaS infrastructure with device groups using policies and filters. Each device group's performance is monitored with dashboards. When new devices come onboard, dashboards are automatically updated to reflect the latest infrastructure. Policy based device management ensures that our platform is current and managed all the time.
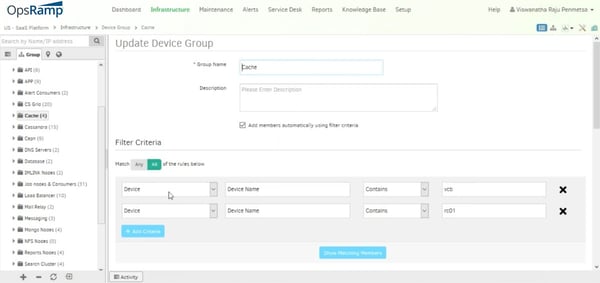
Figure 3 - Device Groups
Discovery Policies
OpsRamp’s discovery profiles rapidly onboard devices across global locations. There are discovery profiles for servers, app nodes, subnets and metrics processors. We define schedules for discovery profiles to collect data across different devices at regular intervals.
OpsRamp uses Gateways and Agents to discover device data. Gateways collect hypervisor and network information while Agents gather operating system metrics.
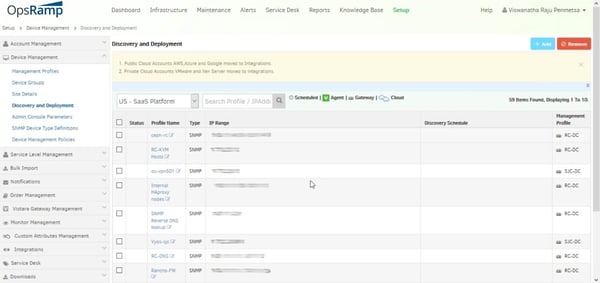
Figure 4 - Discovery & Deployment Policies
Device Management Policies
Device management policies define how to monitor a device. Device management policies apply monitoring templates, knowledge base articles and custom attributes to discovered devices.
Device management policies get triggered whenever a new device gets added. Monitoring templates in OpsRamp automatically manage new devices across their lifecycle.
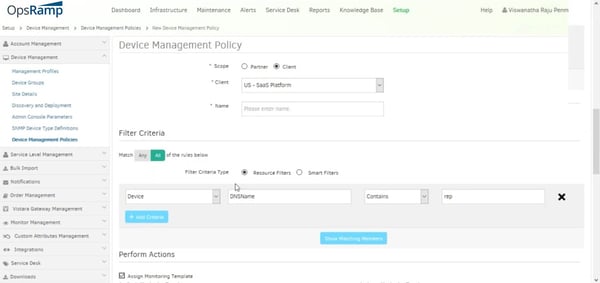
Figure 5 - Device Management Policies
Alert Management
The alerts tab groups related alerts and creates tickets or change requests to manage issues through resolution. We create alerts manually, where the team processes an alert and creates a ticket. We also create alerts using auto incident policies without human intervention. Auto incident policies create tickets for critical alerts and integrate tickets in our Slack workflow.
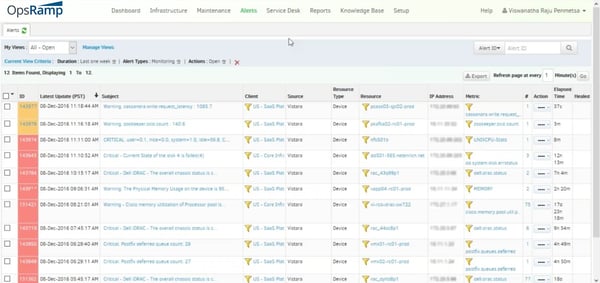
Figure 6 - Alert Browser
Service Desk
Service desk helps us manage service requests for the platform. We track conversations, activity logs, recordings, notes, status and alerts for each ticket. The service desk ensures that all our SaaS operations is auditable and traceable.
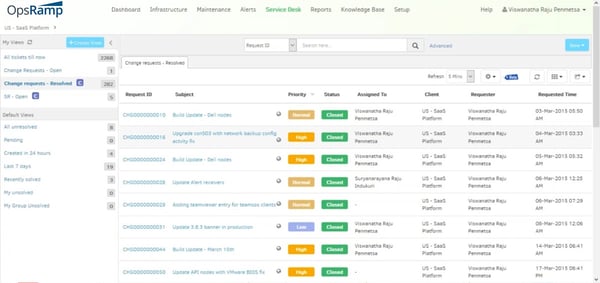
Figure 7 - Service Desk
Knowledge Base
We maintain an active knowledge base for platform maintenance. We segregate knowledge base articles for configuration, data management, deployment, standard operating procedures and troubleshooting.
We assign articles to tickets or devices to help our teams respond and resolve issues faster. We are also able to reduce staff training times with searchable knowledge base articles.
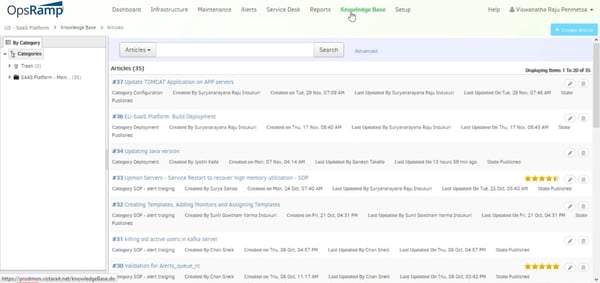
Figure 8 - Knowledge Base
Integrations
Slack
Slack is the internal collaboration tool for the Ops team. Our Slack integration lets us view, address and resolve tickets within designated Slack channels. Slack helps us stay on top of application and infrastructure performance for the platform.
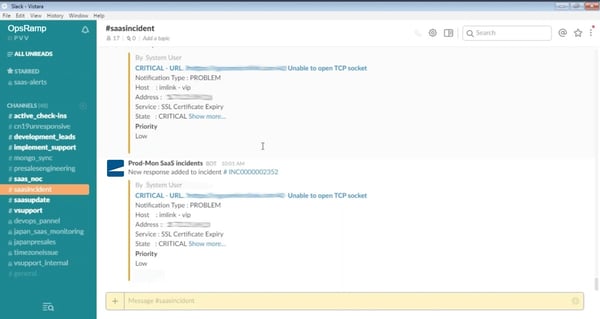
Figure 9 - Slack Incident Management Channels
Jenkins
We use Jenkins for all our build deployments. Our Jenkins integration allows us to build and test codebase during release cycles. When we need to deploy a build, we configure Jenkins jobs to trigger automatic alerts in OpsRamp.


