

This blog is the second in a two-part series and was adapted from The Enterprisers Project.
At a time when CIOs can use cloud infrastructure to turn on new money-making services for customers overnight, how should we measure IT success? Hint: It's not about uptime.
In part 1 of this series, we talked about how traditional IT metrics such as server capacity, I/O, utilization, and network throughput are less relevant today in our highly-digital world. Connecting the dots from these metrics to customer and business-oriented measures is imperative to bring ROI to the organization at large.
With automation increasingly handling the noisy alerts and routine issues, ITOps teams can focus on analyzing business processes and goals and the data which measures them.
Old and New ITOps metrics
| Old | New |
| CPU utilization | Items per order |
| IOPS | Time to complete an online transaction |
| Capacity | Service/subscriptions per customer |
| Latency | Digital interactions per customer |
| Network throughput | Cross-sell/upsell revenue |
| MTTD/MTTR | Employee satisfaction rates with digital tools |
| Time to acknowledge/respond | Employee productivity (invoices approved, contracts created, programs completed, reports generated, customer issues resolved, etc) |
Getting started:
IT operations professionals need to maintain a close eye on capacity, availability, and reliability. But to deliver business value, we need to start thinking about how everything we do affects employees, customers, and revenues.
Work back to the IT metrics. For each service you’re measuring, you’ll need to break it down into steps and processes, and from there, down to the underlying technologies (network, database, storage, VM, instance, transactional systems) that enable it. Engaging with power users, business process owners, and/or developers is often necessary to obtain this view.
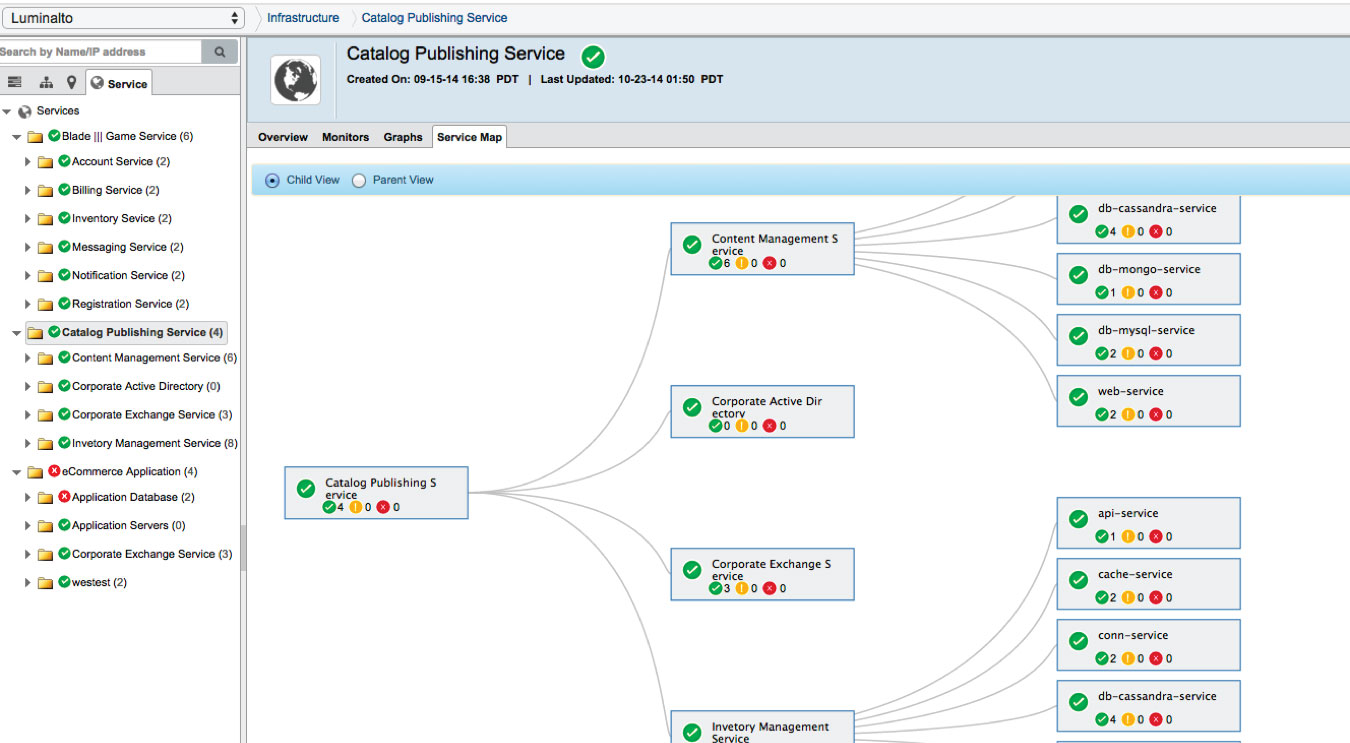
Look for automatic service mapping features in IT operations tools, which can provide easy visuals and drill-down capabilities when analyzing performance. The devil’s in the details, as they say; being able to rapidly pinpoint a brewing problem to the root cause where it can be fixed before it affects users is a competitive advantage.
Find new forms of analytics. Tools that gather customer usage data (such as Pendo) can serve as a starting point for creating new metrics and goals. Having data science skills on your team is a boon; adopting business metrics requires the ability to derive new correlations and conclusions. How can disparate data sets of user/customer activity be used to improve customer adoption of digital tools, inform new features, or reduce investment in less-used ones?
Measure lagging indicators. In e-commerce, revenue per customer is the outcome measure – otherwise known as the lagging indicator. Capture those metrics (which should be easy to get from the sales and marketing team) and use them as a benchmark to continually work against and improve.
Identify the leading indicators. Customer usage and behavior are two critical leading indicators for most organizations. By obtaining end-user data stored across various front and back-office systems, you can start to make correlations with IT performance metrics.
But first, obtain an holistic understanding of the overall business requirements and core processes that support them. Understanding the ways in which the bottom line is affected could lend opportunities for improving it. Cross-functional groups such as Centers of Excellence (COE) can be useful in these efforts.
Refine. As you learn more about user behavior and digital service performance, you can optimize your reporting metrics by improving on leading indicator performance and thereby, business outcomes. The satisfaction of knowing how IT operations changes impact broader organizational metrics and KPIs will be well worth the effort—and your boss will applaud the insights and results that can materialize in time.
Next Steps:
- Read about the 5 Tips for Observability Success
- How to Define Awesome SLOs with OpsRamp
- Predictive Analytics in IT Operations