

The Challenges of Cloud-Scale Management
Migrating workloads to public cloud infrastructure solve many of the day-to-day issues for IT operations teams. With cloud adoption, CIOs no longer need to worry about managing datacenter facilities, monitoring capacity utilization, or tackling energy consumption. Public cloud services, however, bring in their own set of operational challenges:
- How do you monitor workloads across the old (on-prem) and the new (cloud) with the same level of visibility and consistency?
- How do you deliver 99.9% uptime in line with Amazon’s availability and durability service-level agreements if you have an application built on different AWS services?
The elastic, ephemeral, and resilient nature of public cloud services require IT teams to step up their game in terms of availability and performance management. While you might think that the cloud offers ‘always-on availability’, the reality is that cloud infrastructure is subject to the same kind of technology failures that we’ve experienced with datacenters. Most public cloud outages are due to human error (manual processes or botched code deployments), including the famous AWS S3 outage that occurred in February 2017.
Cloud providers offer different monitoring tools for problem recognition and impact analysis. For AWS, CloudWatch helps you track system-wide health and performance by tracking metrics, monitoring logs, and generating alarms. While AWS CloudWatch offers rich monitoring metrics for any type of AWS workload, CloudWatch can be difficult to implement, hard to incorporate within your existing processes, and unpredictable on the cost front.
Why CloudWatch Requires Heavy Lifting For End-To-End Monitoring
If you’re an enterprise that runs several applications on the AWS platform, you probably use different AWS services like EC2, Lambda, S3, Glacier, VPC, Route 53, RDS, and Aurora. You might also need to host your applications in different AWS regions to ensure redundancy for disaster recovery and faster response times for content delivery.
Here are some practical challenges that you’ll need to consider while monitoring your AWS infrastructure with CloudWatch:
- Region-Specific Configurations. You’ll need to configure CloudWatch monitoring separately for each AWS region if you have a global application hosted in different AWS regions. If you’ve deployed your application in the US East (N. Virginia), US West (N. California), EU (London), and Asia Pacific (Singapore), you’ll need to setup CloudWatch metric, dashboard, alarm, and event configurations for all four regions. Also, CloudWatch doesn’t let you combine different region-wise metrics for your various workloads.
- Manual Alarm Configurations. You’ll first need to individually select metrics for your AWS resources for creating an alarm policy and then manually configure alarm notifications in CloudWatch. There’s no automated way to push CloudWatch alarm configurations to either existing or to-be-created workloads without manual scripting.
- Generic Notifications. You can configure CloudWatch to send notifications via email or to Amazon Simple Notification Service (SNS) or Amazon Simple Queue Service (SQS). However, you’ll need to manually configure CloudWatch notifications for each AWS region. You also will not be able to seamlessly integrate CloudWatch notifications with your existing incident, problem, and change management workflows.
- Rudimentary Application Insights. Amazon CloudWatch does not offer any out-of-the-box monitoring templates for managing your enterprise applications. If you need to aggregate advanced logs for your application metrics, you’ll first need to install the CloudWatch agent and then perform manual configurations.
Gain Control Of Your AWS Instances With OpsRamp
OpsRamp’s multitenant SaaS platform lets you scale common operational processes (discovery, monitoring, event correlation, and alerting) for your cloud infrastructure, without placing any extra burden on your DevOps teams. You can create multiple tenants for different teams in OpsRamp and onboard several AWS accounts, resources, and policies in each tenant. You can also configure unlimited AWS accounts in each tenant, for proactive monitoring and enterprise-wide visibility of your AWS resources.
With OpsRamp, you’ll be able to rapidly detect and handle IT outages across your cloud footprint and move quickly on the issues that matter to your business. Combine AWS CloudWatch metrics with OpsRamp’s digital operations command center so that you can diagnose and resolve issues before they impact your end-users:
- Real-Time Analytics. Ingest and store all your CloudWatch metrics in OpsRamp for unified and real-time insights into the availability and health of your cloud applications.
- Immediate Visibility. Stream CloudWatch and CloudTrail logs and alerts into OpsRamp via APIs. There are no limits on the total number of OpsRamp API queries for CloudWatch metrics.
- Data Retention. Retain your entire CloudWatch metrics data in OpsRamp for twelve months. You can also extend CloudWatch data retention for compliance purposes.
- Comprehensive App Monitoring. Complement basic EC2 CloudWatch metrics with OpsRamp’s native monitoring capabilities for your enterprise applications.
- Efficient Cloud Operations. Streamline cloud operations and handle incident remediation at scale with OpsRamp’s automation management framework.
OpsRamp offers simple and transparent pricing based on the number of AWS resources managed. Resource-based pricing includes all of our platform capabilities, without any individual limits for metrics, alarms, events, and dashboards.
Extend AWS CloudWatch Capabilities With OpsRamp
Track your cloud workload performance in real time and prevent outages with effective monitoring of AWS resources in OpsRamp. You’ll be able to drive visibility for public cloud consumption and achieve a single source of truth for all your cloud services. Here are the benefits of combining AWS CloudWatch metrics with OpsRamp’s hybrid infrastructure management platform:
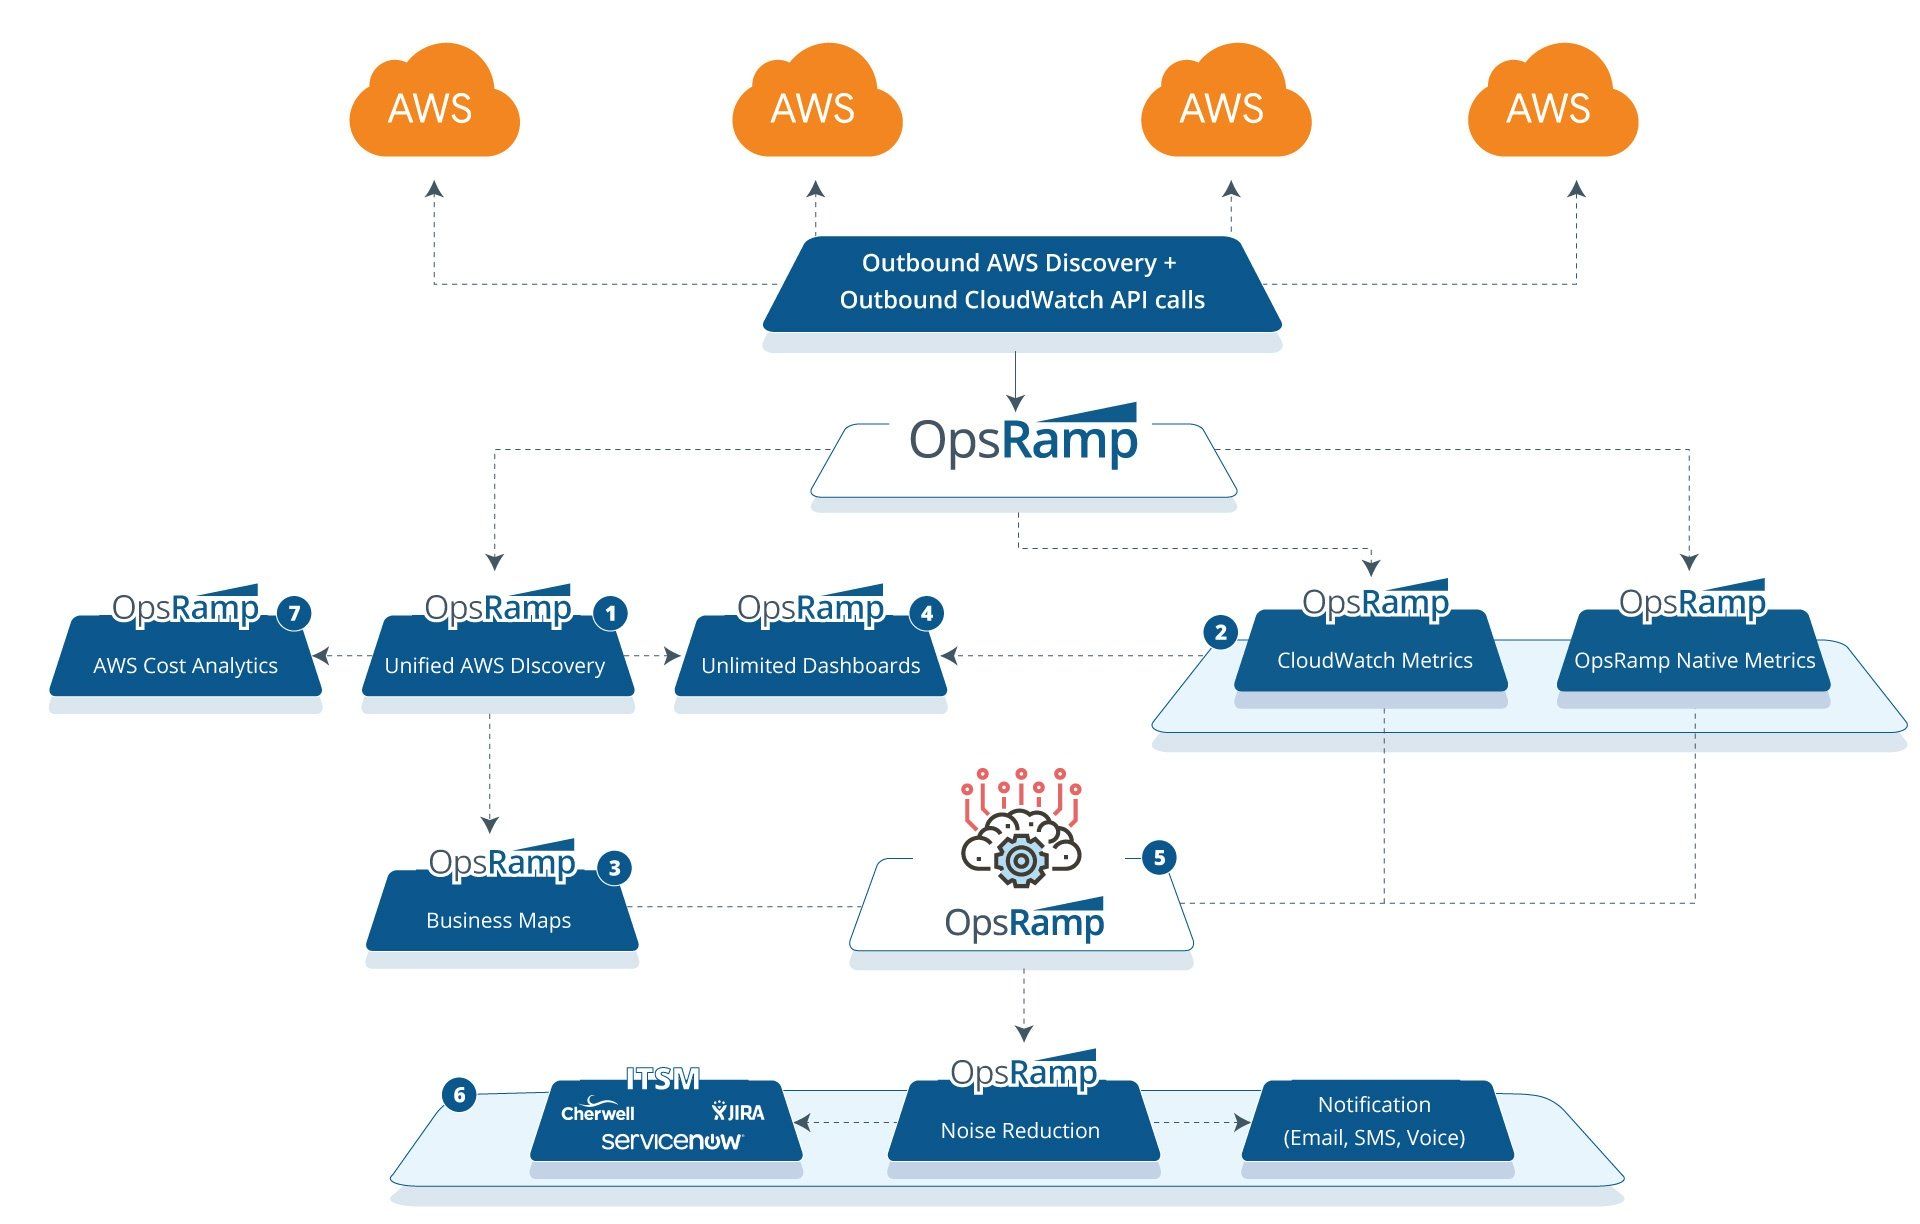
Figure 1 - Manage your entire AWS stack in a single place with OpsRamp.
- Unified Discovery. Onboard all your AWS accounts into OpsRamp and dynamically discover your cloud infrastructure. Stream all your CloudWatch and CloudTrail queues into OpsRamp for proactive visibility into your cloud infrastructure.
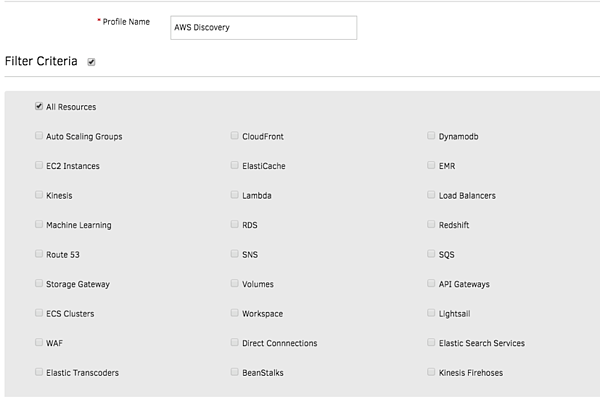
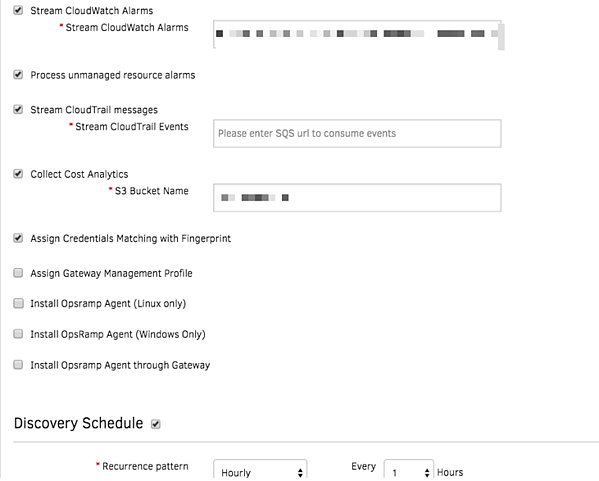 Figure 2 - Discover and onboard dynamic AWS resources with Unified Service Discovery.
- Smart Management Policies. Use OpsRamp’s policies to automatically collect CloudWatch metrics and combine them with metrics collected by the OpsRamp agent. Our application monitors deliver the right context into your application health and performance along with a comprehensive view of your cloud estate.
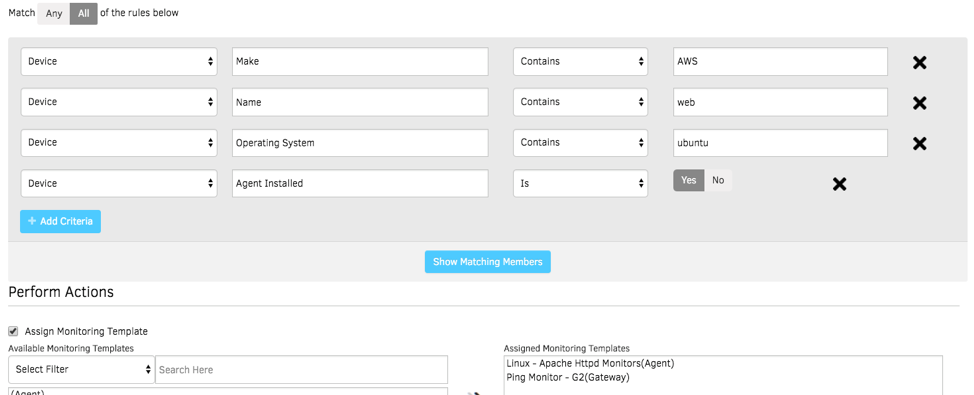
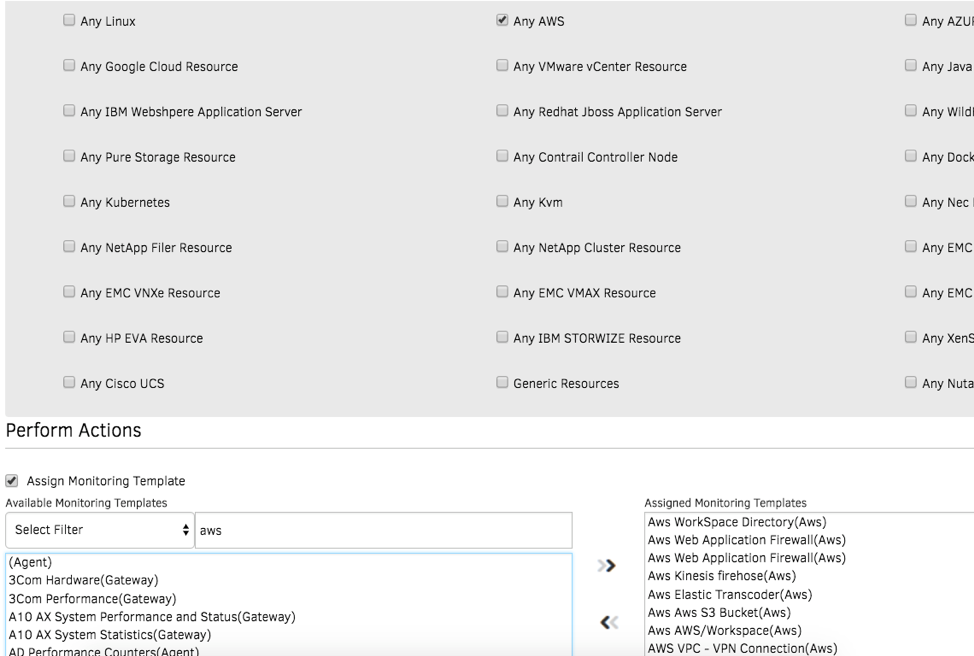
Figure 3 - Smart policies manage the uptime and performance of your cloud infrastructure.
- Service-Centric Visibility. Build service maps for your AWS resources for line-of-sight visibility and faster impact analysis for IT outages. Integrate metrics and alerts into your service map view for better management of your business-critical services.
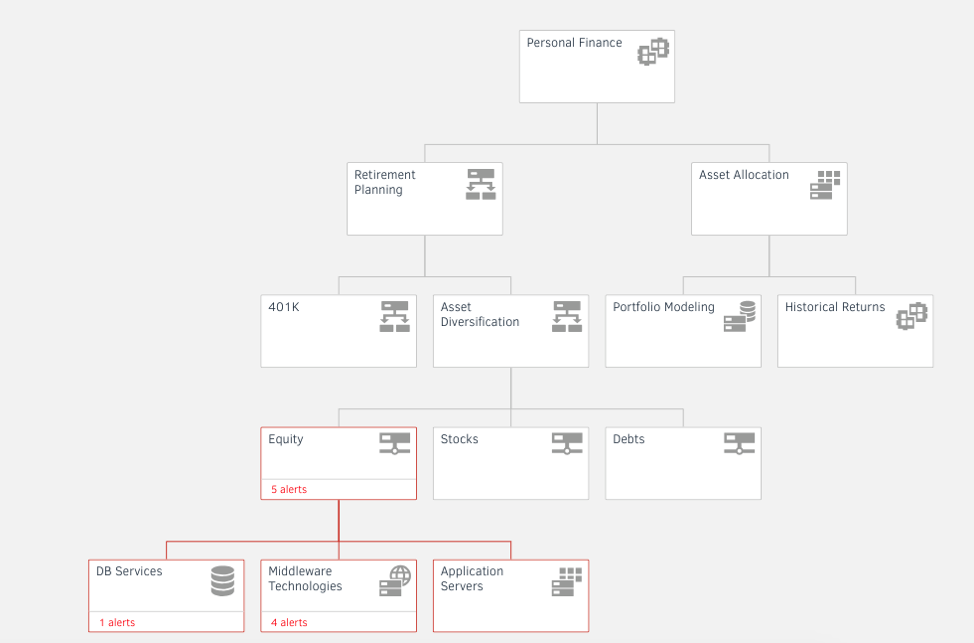
Figure 4 - Track dependencies for applications and AWS resources with Service Maps. - Real-Time Dashboards. Create unlimited dashboards in OpsRamp to distill relevant performance insights for all your CloudWatch metrics and logs. Gain visibility and faster time to insight for your cloud services with customizable, role-based dashboards.
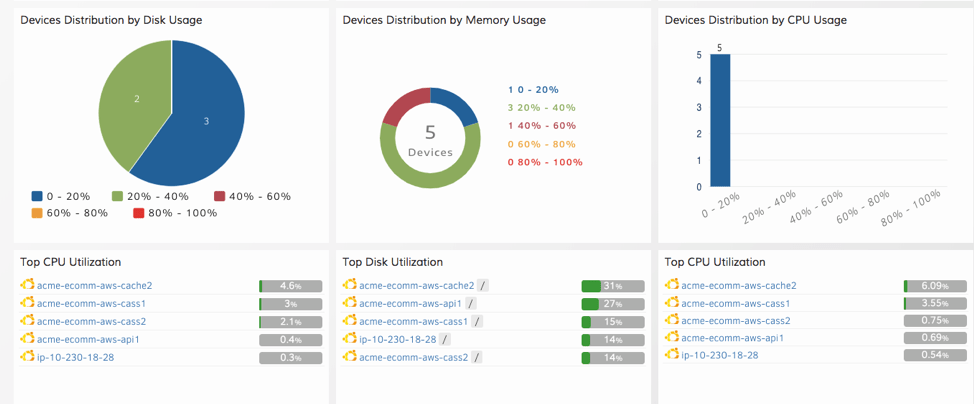
Figure 5 - Manage your AWS infrastructure with better visualization and analytics. - Inference Engine. The AIOps inference engine ingests raw events and alerts from CloudWatch and helps you pinpoint root cause(s) for IT incidents using advanced analytics and topology-based event correlation. You’ll not only be able to reduce alert noise but also troubleshoot IT outages with the right context and confidence.
- Alert Management. Send context-infused alert notifications to on-call operators using targeted routing. You can push notifications using a variety of communication channels, including email, voice, text, and chat. Best of all, create an incident in your service desk and manage it to resolution with robust ITSM tool integrations.
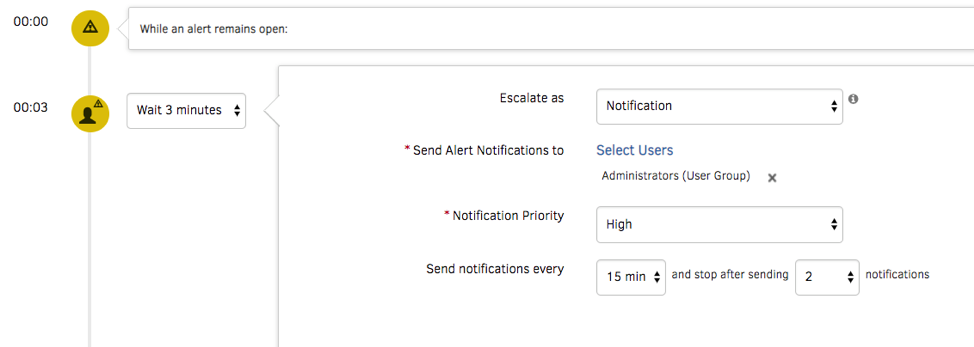
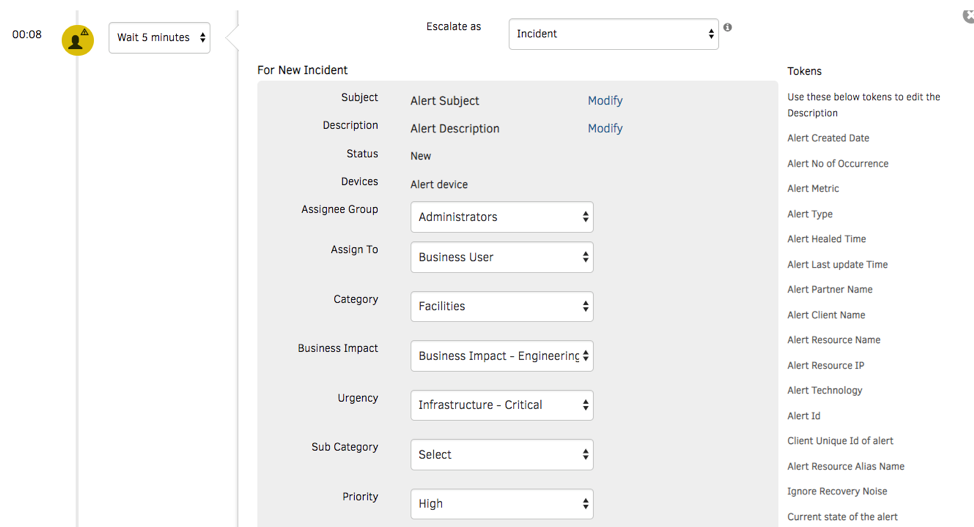
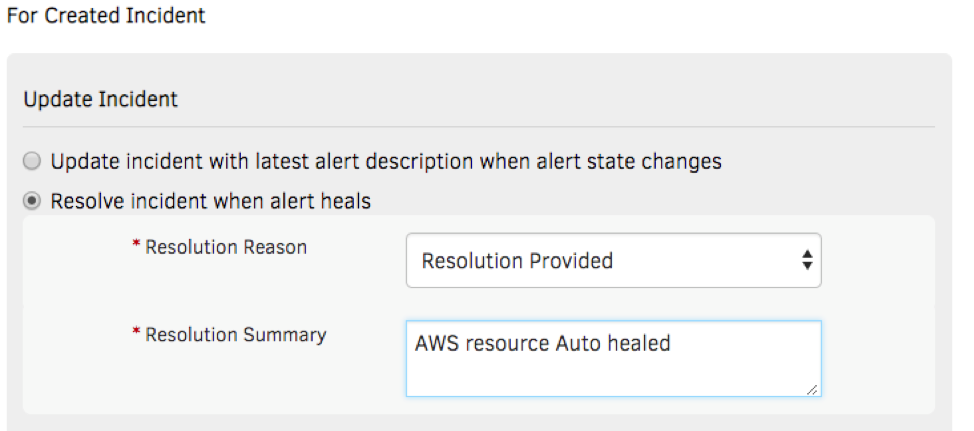
Figure 6 - Restore services promptly with just-in-time alert notifications. - Cost Trends and Budget Policies. OpsRamp consumes cost data directly from your AWS S3 cost buckets so that you can access the latest cost insights. Cloud Cost Trends widgets can slice-and-dice cost data by account, region, AWS tag, resource type, and more. Implement budget policies in OpsRamp to serve as warnings or critical alarms if your cloud spending exceeds a specified budget threshold.
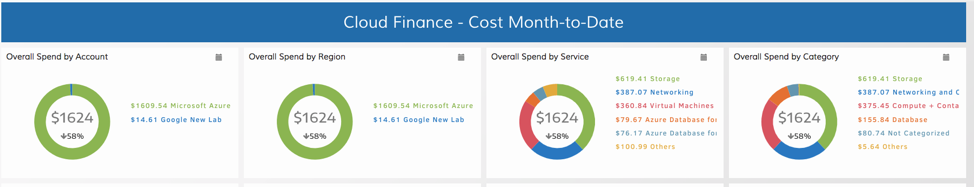
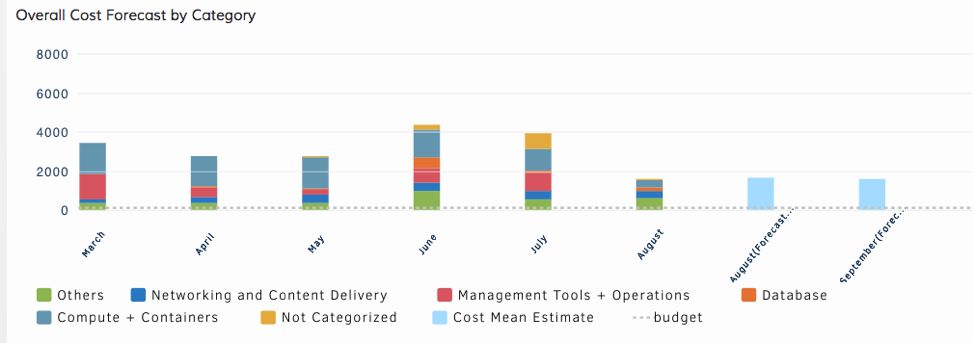
Figure 6 - Access cost and spend insights for your entire AWS estate in a single place.
Next Steps:
- Scale you cloud operations with OpsRamp’s performance and cost insights.
- Build your cloud foundation with the right organizational skills.
- If you’re looking to embrace multi-cloud management with confidence, talk to an OpsRamp solution consultant today.
![[Report] Top Trends In AIOps Adoption](https://blog.opsramp.com/hs-fs/hubfs/Blog_images/AIOps%20Adoption%20Report%20/CTA-AIOps-Adoption.jpg?width=1180&name=CTA-AIOps-Adoption.jpg)